Quantcast
Channel: DHTMLX Blog
Viewing all 228 articles
Browse latest View live

How to convert an Excel file to HTML and JSON with DHTMLX open-source tools

$
0
0

While working on the latest releases of dhtmlxSpreadsheet, our development team created three new tools, which assisted us in converting Excel data into the JSON format (and vice versa) and generating HTML tables from Excel files. We didn’t think long and made these tools open-source and available to everyone. So, what are these three libraries and how do they work?

Based on WebAssembly and Rust

All three libraries were developed using the WebAssembly standard and Rust programming language. These technologies contribute to highly reliable code and fast performance. There are no vulnerabilities in the process of conversion, and you don’t have to worry about the safety of your data while it’s being processed. The small size of code allows you to perform the operations extremely quickly. Thus, you can use our open-source tools in your projects to maintain high-speed and secure websites and web apps.

Turning your Excel data into JSON and back

The first two open-source libraries enable you to transform the data kept in your Excel files into the JSON format and back from JSON to Excel. You can find a detailed description and instructions on GitHub:

You can install the libraries in two ways: via npm or cdn. After the data conversion, you’ll have both data and styles saved in Excel or JSON.

One of the most common use cases, when you might need to convert Excel into JSON and vice versa, is embedding your Excel sheets into a web-based spreadsheet. For example, our JavaScript spreadsheet makes use of the Excel2Json and Json2Excel libraries to provide end users with the ability to import and export Excel files. The spreadsheet has a set of features for further styling and formatting data to achieve the desired appearance.

Displaying Excel data as HTML tables

The third open-source tool Excel2Table was built on the basis of the Excel2Json library, which parses Excel files. The data is rendered as an HTML table preserving all the styles from Excel sheets.

Using the Excel2Table is very straightforward and simple:

1. The first step is to run the following command line to install the library:

npm i excel2table

2. Then import the library into your project:

import "excel2table";

3. And all that is left is to call the render function:

excel2table.render(html_container, data, config);

You can find all the parameters of this function and other technical details described in our GitHub repository.

As a result, you’ll have a precise HTML version of your Excel sheet:
Convert Excel to HTML

Generating such HTML tables comes in useful if you need to equip your app with a preview feature like an Excel file viewer. Or you may link an Excel file to a particular HTML table on your website and update your webpage with the table dynamically when something has changed in Excel sheets. It reduces the amount of manual work on website administration and helps you keep important information up-to-the-minute. Additionally, you can always style your HTML table in accordance to your webpage design to unify their look and feel.

All the three libraries are distributed under the MIT license, which allows you to use them both in non-commercial and commercial projects. If you have any questions regarding the usage of these libraries, please refer them to our team.

We’ll be looking forward to your feedback!

The post How to convert an Excel file to HTML and JSON with DHTMLX open-source tools appeared first on DHTMLX Blog.


Maintenance Release: dhtmlxGantt 6.1.2 and dhtmlxSpreadsheet 3.1.2

$
0
0

Time runs so fast that it’s hard to keep up with its pace and let you know about everything going on in DHTMLX development team. But there are those small things that really matter and make your work with our JavaScript components stable. So, meet the latest pack of improvements in our JavaScript Gantt chart and JavaScript spreadsheet.

What’s new in dhtmlxGantt 6.1.2

March 26, 2019

Updates:

  • (Added) A method for getting the active cell – keyboard navigation

Fixes:

  • (Fixed) Incorrect work of the resource panel after creating a new datastore to overwrite the previous one
  • (Fixed) Incorrect values of query parameters in the POST mode of dataProcessor
  • (Fixed) An incorrect result of gantt.getClosestWorkTime when called without specifying a direction
  • (Fixed) Issue when the English locale couldn’t override the previously added locale
  • (Fixed) Script error with gantt.undo and indent actions in the grid
  • (Fixed) SalesForce compatibility: new resize listener was broken in SF, fallback is added

Download trial version >
What’s new list in documentation >

What’s new in dhtmlxSpreadsheet 3.1.2

March 25, 2019

Fixes:

  • (Fixed) Issues with text styles in Excel export
  • (Fixed) An issue with underlining right-aligned text

Download trial version >
What’s new list in documentation >

Current clients are invited to download the latest versions of their components in the Client’s Area.
We’ll be eager to hear your feedback and ideas on the future updates in the comments below!

The post Maintenance Release: dhtmlxGantt 6.1.2 and dhtmlxSpreadsheet 3.1.2 appeared first on DHTMLX Blog.

How to Specify Columns of the Grid in Gantt – DHTMLX Gantt Video Tutorial

$
0
0

We’re happy to announce a new series of our video tutorials devoted to the configuration of DHTMLX Gantt chart!

In the first video from our series, we’ll show you how to specify columns of the left-hand grid and give you a small overview of templating and formatting functions in dhtmlxGantt:

The columns of the grid in a Gantt chart are specified as an array of objects inside the ‘columns’ config.
A typical configuration can look like this:

gantt.config.columns = [
    {name: "text", tree: true, width: '*', resize: true},
    {name: "start_date", align: "center", resize: true},
    {name: "duration", align: "center"},
    {name: "add", width: 44}
];

In fact, this is the configuration you’ll have by default even if you don’t specify this setting in your app.

Columns have quite a lot of optional properties. An important thing to know is that only the ‘name’ property is mandatory. Its main purpose is to define the content of cells. By default, the cell will take the value from the matching property of the task:

document.addEventListener("DOMContentLoaded", function(event) {

    gantt.config.columns = [
        {name: "text", tree: true, width: '*', resize: true},
        {name: "start_date", align: "center", resize: true},
        {name: "duration", align: "center"},
        {name: "add", width: 44}
    ];

  gantt.init("gantt_here");
 
 
  gantt.parse({
    data: [
        {
            id: 1, text: "Project #2", start_date: "01-04-2018", duration: 18, order: 10,
            progress: 0.4, open: true
        },
        {
            id: 2, text: "Task #1", start_date: "02-04-2018", duration: 8, order: 10,
            progress: 0.6, parent: 1
        },
        {
            id: 3, text: "Task #2", start_date: "11-04-2018", duration: 8, order: 20,
            progress: 0.6, parent: 1
        }
    ],
    links: [
        {id: 1, source: 1, target: 2, type: "1"},
        {id: 2, source: 2, target: 3, type: "0"}
    ]
  });
});

Check a live example >

As you can see in our example above, the column named ‘text’ displays values from the ‘text’ property of the task object. The same applies to the start date and duration.

The only exception is the column named ‘add’ – it’s a predefined value that displays the ‘+’ sign which allows users to add children for the task.

Basic Grid in DHTMLX GanttBasic Grid configuration in DHTMLX Gantt

Based on that, you can specify your own columns. For example, to define four custom columns in the grid such as ‘Task name’, ‘Holder’, ‘Start Time’, and ‘Progress’, we should specify the columns parameter, where ‘text’, ‘holder’, ‘start_date’, and ‘progress’ are the names of the data properties.

gantt.config.columns =  [
   {name:"text",       label:"Task name",  tree:true, width: 150 },
   {name:"holder",     label:"Holder",     align:"center", width: 80 },
   {name:"start_date", label:"Start time", align:"center", width: 80 },
   {name:"progress",   label:"Progress",   align:"center", width: 80 },
];

Custom columns of the grid in DHTMLX GanttCustom columns in the grid of dhtmlxGantt

But what if you want to format values before displaying them inside cells? In this case, you’ll need to use the ‘template’ property of the column. Here is how our previous example can look like if we use the template in it:

gantt.config.columns =  [
    {name:"text",       label:"Task name",  tree:true, width:"*" },
    {name:"start_date", label:"Start time", align: "center" },
    {name:"staff",      label:"Holder(s)", template:function(obj){
                                return obj.holder+"("+obj.progress")"} }
];

Check a live example >

DHTMLX Gantt templateThe template property in dhtmlxGantt

The template will be called each time the column is repainted and the return value will be put into the inner HTML of the cell. This is an important trait of almost all templates used in the Gantt chart. The content of the templated element is completely replaced after each update. It means that if you modify such DOM element directly from code, all your changes will be lost after the template is called next time.

Therefore, if you need to change the type of the cell line in response to a user action, the best way is not to change styles directly, but to set the necessary styles and markup using the template function.

gantt.config.columns =  [
    {name:"text",       label:"Task name",  tree:true, template(task){
            if(gantt.getState().selected_task == task.id){
                return "<b>" + task.text + "</b>";
            }else{
              return task.text;
            };
        } },
    {name:"start_date", label:"Start time", align: "center" },
    {name:"staff",      label:"Holder(s)", template:function(obj){
            return obj.holder+"("+obj.progress+")"} }
    ];

Check a live example >

Secondly, it’s important to note that templates deal with raw HTML values and don’t sanitize data you return from them in any way. It’s a conscious design decision, which allows you to freely customize most of the Gantt elements. But it has one serious consequence – such templates can serve as entry points for XSS attacks. Let’s consider the next example:

document.addEventListener("DOMContentLoaded", function(event) {
    gantt.config.columns =  [
    {name:"text",       label:"Task name",  tree:true, template(task){
            if(gantt.getState().selected_task == task.id){
                return "<b>" + task.text + "</b>";
            }else{
              return task.text;
            };
        } },
    {name:"start_date", label:"Start time", align: "center" },
    {name:"staff",      label:"Holder(s)", template:function(obj){
            return obj.holder+"("+obj.progress+")"} }
    ];

 gantt.init("gantt_here");
 
  gantt.parse({
    data: [
        {
            id: 1, text: "<img onerror='javascript:alert(\"it can`t be good\")' src='' />", start_date: "01-04-2018", duration: 18,
            progress: 0.4, holder:"Mike", open: true
        },
        {
            id: 2, text: "Task #1", start_date: "02-04-2018", duration: 8,
            progress: 0.6, holder:"John", parent: 1
        },
        {
            id: 3, text: "Task #2", start_date: "11-04-2018", duration: 8,
            progress: 0.6, holder:"Mike", parent: 1
        }
    ],
    links: [
        {id: 1, source: 1, target: 2, type: "1"},
        {id: 2, source: 2, target: 3, type: "0"}
    ]
  });
});

Check a live example >

It’s the same date as before, but this time we’ve added a certain HTML string into the task text. Now, look at what happens when we run the example. The javascript code that we’ve put in the data has been executed on the page. If the backend of a real application returned such data, that code would run in browsers of every user who would open this project. These types of attacks are often used to inject malicious code into an application in order to steal any sensitive data or change the content of your page. It’s a responsibility of a backend developer to ensure that the data feed returns data without unsafe HTML in it. Once you ensure your data source is secure and can be trusted, Gantt templates are perfectly safe.

In addition, to be able to set the Grid configuration, you can also change it dynamically. For example, if you want to give a user an ability to switch between detailed and compact Grid views.

Detailed view of the grid in GanttDetailed view of the grid in Gantt

You can do it simply by assigning a new value to the columns config and repainting Gantt.

document.addEventListener("DOMContentLoaded", function(event) {

    var largeGrid = [
    {name: "text",       label:"Name",  tree:true, width: 200 },
    {name: "start_date", label:"Start", align: "center", width: 70 },
        {name: "end_date",   label:"End", width: 70 },
        {name: "duration",   label:"Duration", width: 70 },
    {name: "staff",      label:"Holder(s)", template:function(obj){
            return obj.holder+"("+obj.progress+")"}, width: 70  },
        {name: "add", width: 44}
    ];
    var largeGridWidth = 550;
   

    var smallGrid = [
    {name: "text",       label:"Task name",  tree:true, width: 200  },
    {name: "start_date", label:"Start time", align: "center", width: 70  },
    {name: "staff",      label:"Holder(s)", template:function(obj){
            return obj.holder+"("+obj.progress+")"}, width: 70  }
    ];
    var smallGridWidth = 340;

    gantt.toggleGrid = function(){
        var newGrid;
        var newGridWidth;
        if(gantt.config.columns == largeGrid){
            newGrid = smallGrid;
            newGridWidth = smallGridWidth
        }else{
            newGrid = largeGrid;
            newGridWidth = largeGridWidth;
        }

        gantt.config.columns = newGrid;
        gantt.config.grid_width = newGridWidth;
        gantt.render();
    };

    gantt.config.columns = smallGrid;
    gantt.config.grid_width = smallGridWidth;
  gantt.init("gantt_here");

Check a live example >

If you’d like to try to configure a grid of the Gantt chart on your own, just follow these steps:

Hope this tutorial will come in useful for you! Don’t hesitate to leave your comments below if you have any questions.

Check other video tutorials by DHTMLX:

The post How to Specify Columns of the Grid in Gantt – DHTMLX Gantt Video Tutorial appeared first on DHTMLX Blog.

Maintenance Release: dhtmlxGantt 6.1.3, 6.1.4, and 6.1.5

$
0
0

The development of our JavaScript Gantt chart library has been moving at a quick pace in April. Our dev team has fixed several bugs, increased performance, and made other slight improvements in the work of the component. You can get acquainted with the whole list of updates below.

What’s New in dhtmlxGantt 6.1.3

April 15, 2019

  • gantt.createTask/gantt.addTask should use root_id config value instead of hardcoded 0 id
  • Performance increase for worktime calculations for minute and hour duration units
  • Minor performance increase for rendering large lists of tasks in the smart rendering mode
  • Ensure vertical drag-and-drop doesn’t start when the user selects text inside an inline editor
  • Fix script error on reinitialization of Gantt in the IE browser
  • Fix script error from keyboard navigation in the cell mode after deleting last tasks from the chart
  • Ensure Gantt cleans up autogenerated static background style elements after destruction or reinitialization
  • Ensure inline editors are not active when the read-only mode is enabled
  • Fix incorrect selection of grid header cells in the cell mode of keyboard navigation when the sort config is enabled
  • Fix regression in the auto_types config which prevented auto type change when new tasks are added
  • Fix bug when returning false from onTaskDblClick blocked onLinkDblClick as well
  • Fix script error when parsing constraint dates from JSON data
  • Fix incorrect position of tasks and markers with the skip_off_time config
  • Fix incorrect height of markers after reordering tasks via drag and drop
  • New tasks receive the initial value of the progress property
  • Fix incorrect task position after vertical drag and drop in the marker mode
  • Fix script error from gantt.destructor when the resource panel is enabled
  • Fix the bug which caused an empty line to be displayed in a typeselect block
  • Fix the bug which caused a task not to be recognized as a part of critical path after id change
What’s New in dhtmlxGantt 6.1.4

April 18, 2019

  • Fix script error on reinitialization of gantt in the IE browser
  • Fix incorrect behavior of the Tooltip extension when gantt.destructor is called
  • Fix incorrect work of inline editors in the keyboard_navigation_cells mode when grid contains hidden columns
  • Fix bug in the Undo extension when Redo action for recreation of new tasks did not restore all properties
  • Fix regression in GPL build which caused a script error on a second gantt.init call
What’s New in dhtmlxGantt 6.1.5

April 25, 2019

  • Fix script error on a second init call when show_chart config is disabled
  • Fix incorrect position of vertical drag-and-drop placeholder in the marker mode

The Gantt chart trial version has encompassed all the recent updates – download it and enjoy 30 days of free evaluation and technical support.

If you’re already a licensed customer, please get the latest PRO version in your Client’s Area.

Looking forward to your feedback!

The post Maintenance Release: dhtmlxGantt 6.1.3, 6.1.4, and 6.1.5 appeared first on DHTMLX Blog.

Four Things You Need to Know About JavaScript Arrays [Guest Post]

$
0
0

Arrays are a powerful and comprehensive tool of Javascript. They are very intuitive to use and you can do almost everything with them. However, there are important differences between arrays in Javascript and other mainstream languages. Knowing them will help developers unleash their true potential.

If you need to speed up the development process, you can choose outsourced JavaScript Developers. In addition, there are a lot of custom software development companies such as Brights, which can support you also with QA, UX/UI Design or Architecture.

When we speak about crossing an array, searching for elements, and other actions, there is the most appropriate array method for this. However, some methods are shaded. We will talk about the useful methods of arrays that are imperative to every JS developer.

The Basic Things

There are four things you need to know working with arrays – map, filter, reduce, and spread operator. They are a powerful basis.

1. Map
Probably, you often deal with this method. It is used for the element by element array transformation into a new one. The map() method takes only one parameter — a function that is generated at each iteration over the array. The method returns a new array and does not modify the existing one. So, if you need the element by element array transformation into a new one, use map().

2. Filter
Technically, the name of the method speaks for itself: it is used when you need to filter the array. As with map(), filter() method takes only one parameter — a function that is generated at each iteration. The function must return a boolean value. After that, you get a filtered array with the elements you need.

3. Reduce
Perhaps, this is a rather difficult method for understanding. But one day you will understand how many cool things you can do with it. Reduce() method is designed to combine array values into one value. The method proceeds two parameters. The first one is the callback function (reducer), the second is the primary value, which is optional and is the first element of the array by default.

The callback function accepts four arguments:

  • accumulator (where the intermediate result of iterations is stored)
  • current array value
  • current index
  • array itself

In most cases, all it takes is these first two arguments: intermediate result and current value. The reduce() method is so good that with its help you can create other array methods, for example, map() or filter().

4. Spread operator (ES2015 standard)
Despite the fact that the operator is not a method, it can help a lot with arrays. For example, you can make copies of arrays or combine several arrays into one. Note that this statement creates a superficial copy of the original array.

Summarizing all the above-mentioned information, it is important to say, that every time you need to process an array, it is not necessary to reinvent the wheel. Probably, this has already been done for you. Look for a suitable method. In most cases, the task can be solved using map (), filter (), reduce () or spread operator methods.

The post Four Things You Need to Know About JavaScript Arrays [Guest Post] appeared first on DHTMLX Blog.

How to Add Custom Elements into the Grid of JavaScript Gantt – DHTMLX Gantt Video Tutorial

$
0
0

Here is a second video from a series of tutorials devoted to the configuration of the grid in dhtmlxGantt. In this video, we’ll discuss how all kinds of buttons, icons, and dropdown menus can be added into the grid cells and headers of a JavaScript Gantt chart:

Let’s say we need to create a column with custom buttons for performing user actions:
Custom buttons in Gantt

We can add buttons using the following template and “Font Awesome” icons, for instance:

gantt.config.columns = [
        {name: "text", tree: true, width: '*', resize: true},
        {name: "start_date", align: "center", resize: true},
        {name: "duration", align: "center"},
        {name: "buttons",label: colHeader,width: 75,template: function (task) {
            return (
                '<i class="fa fa-pencil" data-action="edit"></i>' +
                '<i class="fa fa-plus" data-action="add"></i>' +
                '<i class="fa fa-times" data-action="delete"></i>'
                );
        }}
    ];

Check a live example >

Since buttons will be repainted together with the rest of the row, we can’t just use something like ‘addEventListener’ or jquery click handler to add an event listener to each button. Instead, we can either add a handler using an inline onclick attribute or use an approach called event delegation – add a single event listener to a parent element that won’t be affected by the repaints and capture a click there. Luckily, Gantt provides a public click event that will fire each time a user clicks an element related to the task.
We can capture user clicks there:

gantt.attachEvent("onTaskClick", function(id, e){
        var button = e.target.closest("[data-action]")
        if(button){
            var action = button.getAttribute("data-action");
            switch (action) {
                case "edit":
                    gantt.showLightbox(id);
                    break;
                case "add":
                    gantt.createTask(null, id);
                    break;
                case "delete":
                    gantt.confirm({
                        title: gantt.locale.labels.confirm_deleting_title,
                        text: gantt.locale.labels.confirm_deleting,
                        callback: function (res) {
                            if (res)
                                gantt.deleteTask(id);
                        }
                    });
                    break;
            }
            return false;

        }
        return true;
    });

In the handler, we check whether a clicked element is one of our buttons, and if so – figure out what action should be done and then do it.

As for the column header, we can put its HTML into the label property of the column and add the inline onclick handler there:

var colHeader = '<div class="gantt_grid_head_cell gantt_grid_head_add" onclick="gantt.createTask()"></div>';

    gantt.config.columns = [
        {name: "text", tree: true, width: '*', resize: true},
        {name: "start_date", align: "center", resize: true},
        {name: "duration", align: "center"},
        {name: "buttons",label: colHeader,width: 75,template: function (task) {
            return (
                '<i class="fa fa-pencil" data-action="edit"></i>' +
                '<i class="fa fa-plus" data-action="add"></i>' +
                '<i class="fa fa-times" data-action="delete"></i>'
                );
        }}
    ];

The same approach can be used for more complex controls like adding a dropdown menu into the grid header:
Dropdown menu in JavaScript Gantt

As you might have guessed, we will also add the required HTML into the column label. In that case, we will have an inline onclick argument, which would open a dropdown menu. Note that the handler has to be available from the global scope, so we define it in the gantt object:

gantt.$showDropdown = function(node){
    var position = node.getBoundingClientRect();
    var dropDown = getDropdownNode();
    dropDown.style.top = position.bottom + "px";
    dropDown.style.left = position.left + "px";
    dropDown.style.display = "block";
    dropDown.keep = true;
    setTimeout(function(){
      dropDown.keep = false;
    })
  }
  gantt.$hideDropdown = function(){
    var dropDown = getDropdownNode();
    dropDown.style.display = "none";
  }
  window.addEventListener("click", function(event){
    if(!event.target.closest("#gantt_dropdown") && !getDropdownNode().keep){
      gantt.$hideDropdown();
    }
  })

  var colHeader = '<div class="gantt_grid_head_cell gantt_grid_head_add" onclick="gantt.createTask()"></div><div class="gantt-dropdown" onclick="gantt.$showDropdown(this)">&#9660;</div>';

  gantt.config.columns = [
    {name: "text", tree: true, width: '*', resize: true},
    {name: "start_date", align: "center", resize: true},
    {name: "duration", align: "center"},
    {name: "buttons",label: colHeader,width: 75,template: function (task) {
      return (
        '<i class="fa fa-pencil" data-action="edit"></i>' +
        '<i class="fa fa-plus" data-action="add"></i>' +
        '<i class="fa fa-times" data-action="delete"></i>'
        );
    }}

Check a live example >

That’s how you can easily add custom elements such as a button or an input into grid columns with the help of HTML.

In order to try it all out yourself, get a free trial version of our JavaScript Gantt and follow the steps from our video tutorial!

We’ll be looking forward to your feedback and any ideas on what else you’d like to see in our videos. Meanwhile, check our YouTube channel and subscribe to stay tuned!

Check the first video in the series of tutorials about Grid configuration in Gantt:

The post How to Add Custom Elements into the Grid of JavaScript Gantt – DHTMLX Gantt Video Tutorial appeared first on DHTMLX Blog.

Maintenance Release: dhtmlxGantt 6.1.6

$
0
0

While awaiting minor and major releases of our JavaScript components, we have rolled out another maintenance release of the Gantt chart library with the following set of updates:

  • (Fixed) Issue with not working click handlers of QuickInfo popup after a second init call
  • (Fixed) Issue with QuickInfo popup not showing up if show_chart is set to false
  • (Fixed) Incorrect action argument for dataProcessor router after vertical drag-and-drop
  • (Fixed) Issue when createTask ignores the index parameter

Read the detailed description of all changes in the documentation.

All current clients may find the latest version 6.1.6 in their Client’s Area.
If you’re new to dhtmlxGantt, we invite you to download and test the library during a free 30-day evaluation period.

Check out Gantt roadmap and vote for the most anticipated features of yours. Don’t hesitate to leave your feedback in the comments below!

The post Maintenance Release: dhtmlxGantt 6.1.6 appeared first on DHTMLX Blog.

dhtmlxScheduler 5.2: Custom Content in the Timeline View and Enhanced Drag-n-Drop

$
0
0

Here comes the new version 5.2 of our JavaScript scheduling library! The highlight of the release is the introduction of custom content in the cells of the Timeline view. Besides, v5.2 brings out enhanced drag-n-drop of events, a smarter way of parsing data, API update, and a range of other minor improvements. We’ll dive deeper into the new features in our blog post.

If you’d rather skip the reading part, we invite you to get down to the evaluation of Scheduler 5.2 at once.

Adding Custom Content in All Modes of the Timeline View

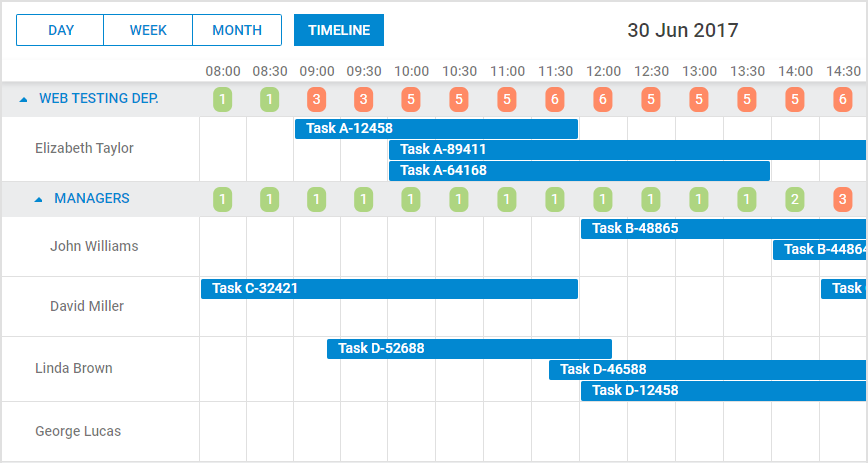
This functionality enables developers to set a custom template for the content of cells in the Tree mode and all other modes of the Timeline view. For instance, you may add the summary of all the assigned tasks or work hours per each employer in the parent row in the Tree mode. In the example below you can see that the values displayed in the cells of the managers’ row reflect the number of tasks assigned to each manager:

Custom content in the Tree TimelineCheck the sample >

In order to set a custom template for a particular Timeline mode, you just need to add one line of code and apply the cell_template property:

scheduler.createTimelineView({
    ...
    cell_template: true
});

The template for displaying the number of events per day in the Tree mode of the Timeline view may look like that:

scheduler.templates.timeline_cell_value = function (evs, date, section){
    if(section.children){
        var timeline = scheduler.getView();
 
        var events = timeline.selectEvents({
            section: section.key,
            date: date,
            selectNested: true
        });
 
        var className = "";
        if(!events.length){
            className = "load-marker-no";
        }else if(events.length < 3){
            className = "load-marker-light";
        }else{
            className = "load-marker-high";
        }
 
        return "<div class='load-marker "+className+"'>"+
            events.length
        +"</div>";
 
    }
 
    return "";
};

Read more in our docs >

Enhanced Drag-n-Drop of Events

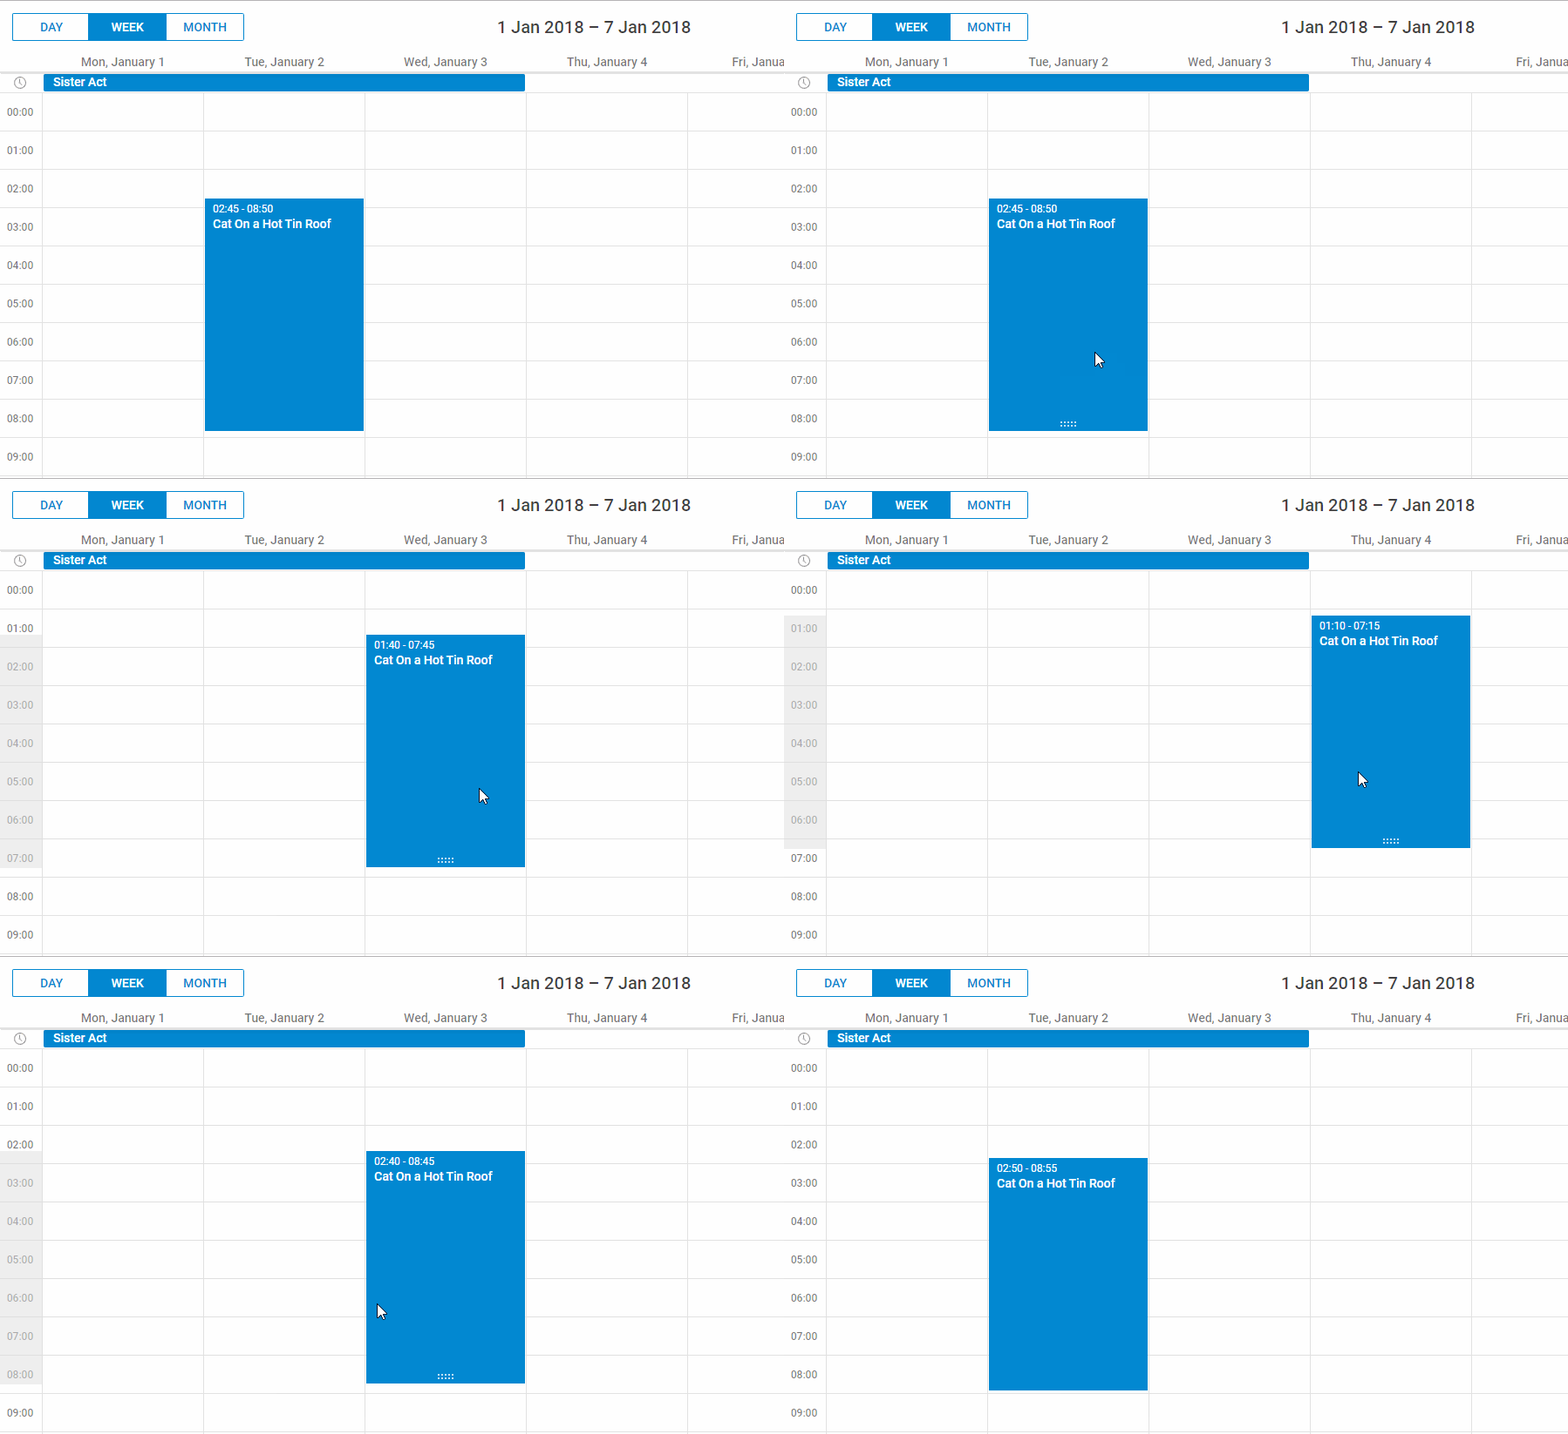
V5.2 introduces a more intuitive way of moving events with the help of drag-n-drop than before. Now end users may drag tasks by clicking and holding any part of the event:

Enhanced drag-n-dropCheck the sample >

This setting is available by default. However, if you need to enable drag-n-drop of events by the header, you may specify the necessary configuration option:

scheduler.config.drag_event_body = false;

Read more in our docs >

API Updates and Other Improvements

Apart from the features described above, dhtmlxScheduler 5.2 has a largely updated API. Some odd and outdated methods have been deprecated and replaced with more intuitive ones.

Additionally, we’ve modified the way dhtmlxScheduler parses dates. New users often faced up a problem when a misplaced date format config caused Scheduler to parse dates of events incorrectly, which resulted in a blank calendar without any obvious errors. Now Scheduler will handle formats of the incoming data automatically and everything will work smoothly.

Several bug fixes have also taken place in the release. The most notable improvement is that we’ve corrected the majority of the known issues with the scrollable timeline introduced in the previous update 5.1. There have also been a number of changes aimed at enhancing the user experience on the iPad and other touch devices.

We have also made modifications in the Scheduler package. Starting with v5.2, the dhtmlxConnector library is no longer shipped with the dhtmlxScheduler package. From now on, all samples are provided on the basis of Node.js instead of PHP. Now you’ll only need to have Node.js installed on your computer to launch all the samples locally. Besides, we have switched to using mainly the JSON format instead of XML.

You may get acquainted with all these updates in the “What’s New” section.

We invite you to download the trial version 5.2 of dhtmlxScheduler and evaluate the updated library for free for 30 days. Current clients may get the latest version in their Client’s Area.

We’ll be looking forward to your feedback! Stay tuned for future updates!

Related Materials:

The post dhtmlxScheduler 5.2: Custom Content in the Timeline View and Enhanced Drag-n-Drop appeared first on DHTMLX Blog.


dhtmlxSuite 6.0 Rolled Out: Large-Scale Update of the JavaScript UI Library

$
0
0

Great news – Suite 6.0 is out! DHTMLX JavaScript UI library has received an extensive update and now presents completely renewed and modernized JavaScript components for building powerful and trendy web interfaces.

JavaScript UI Framework DHTMLX Suite

What is Suite 6.0?

dhtmlxSuite 6.0 is a brand new version of DHTMLX UI library. It is compatible with the most modern browsers starting with IE11+. The library can be smoothly integrated with Angular, React, and Vue.js frameworks.

Suite 6.0 comprises 21 JavaScript components, which can be neatly assembled in one feature-rich user interface. Integrating the components with each other is straightforward due to the universal system of data processing with the help of the Data and Tree collection. The architecture allows developers to implement any modern technologies they wish.

All the UI components are designed on the basis of Material style. The library enables complete customization of the interface via CSS.

The aim of developing a completely renewed Suite was to provide developers with a comprehensive yet flexible tool for building modern web apps with no limits to customization.

dhtmlxSuite 6.0 JavaScript UI Components

So, let’s have a closer look at the components included in the dhtmlxSuite 6.0 library. We have grouped them according to their purpose.

Layout Components: Layout, Tabbar, Window

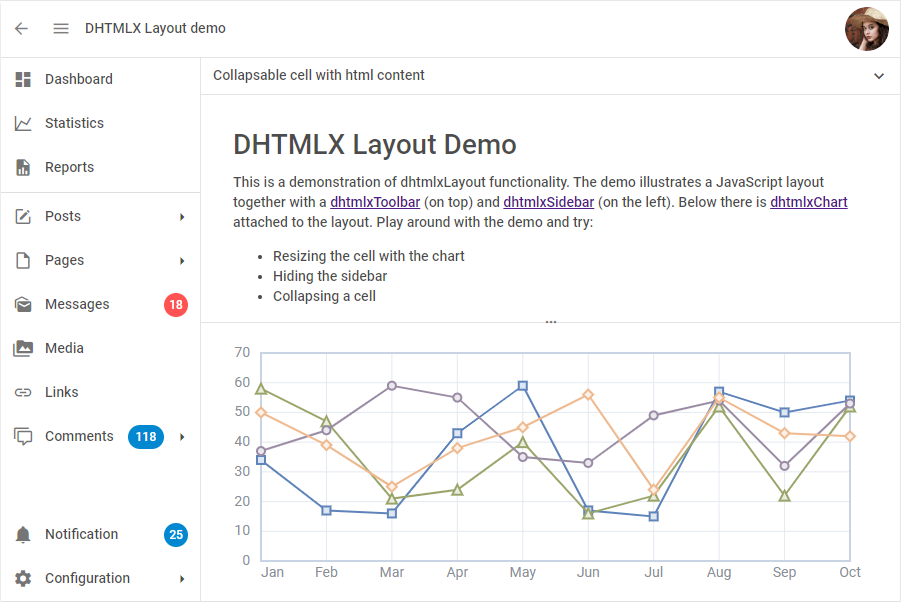
These are the most basic components, which serve as the foundation of any user interface. dhtmlxLayout as a key part of the library makes it easy to arrange all other UI components on a webpage. Below you can see how various UI elements like a sidebar, toolbar, chart, and some custom HTML content can be organized using the layout component:

JavaScript Layout Library by DHTMLX
Data Processing Components: List, DataView, Grid, Tree, TreeGrid

The following group represents a range of components for working with data: arranging data in different views (list, dataview, grid, tree), filtering and sorting data, etc. The filtering and sorting functions, as well as managing data in all possible ways, are common for all these components due to the ubiquitous system of data processing via Data and Tree collection.
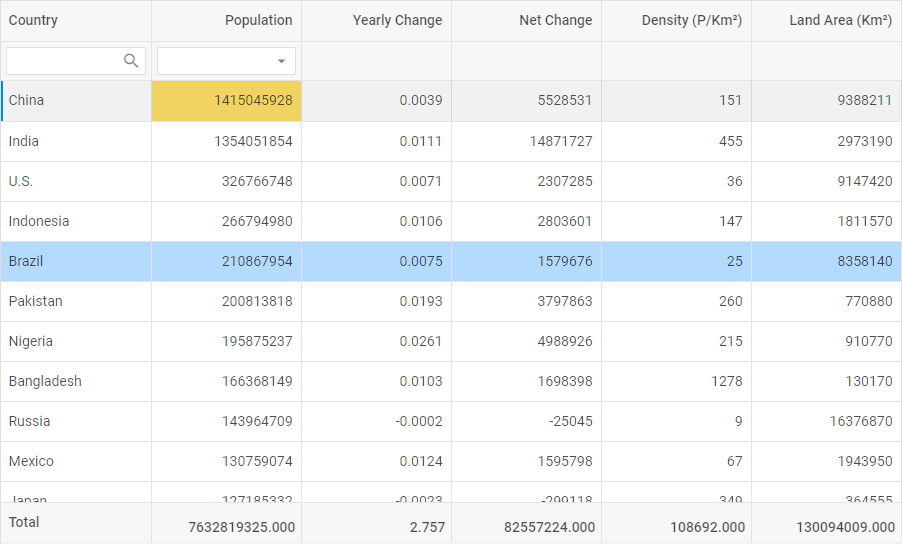
Here is an example of a JavaScript grid with a footer containing the sum of values from column cells, one selected row, and cells with custom marks:

JavaScript Grid by DHTMLX

Data Visualization Components: Charts

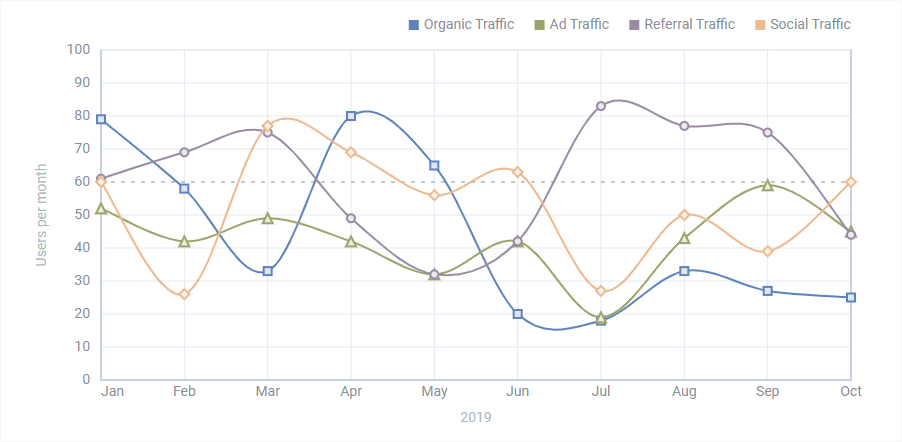
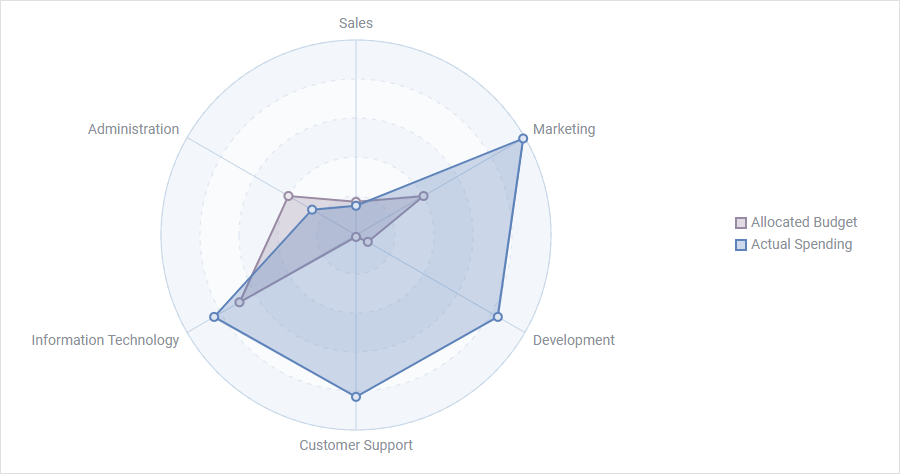
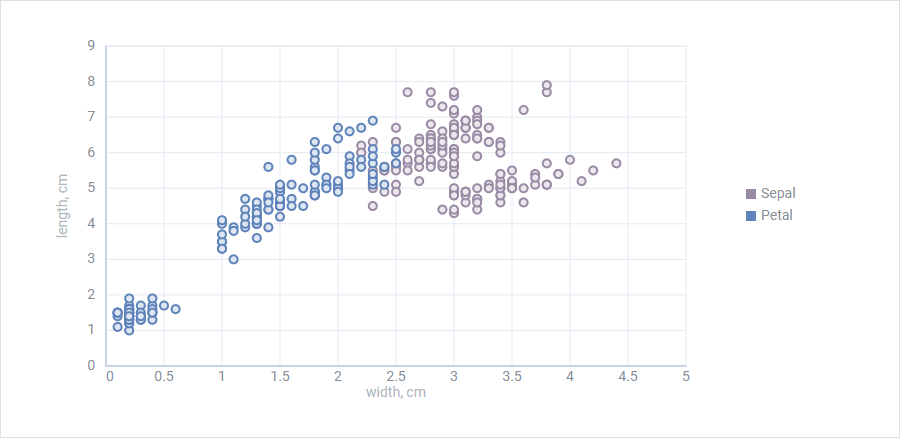
The JavaScript charting library includes 11 types of charts: Line and Spline charts, Bar and X-Bar charts, Area and Spline Area charts, Pie and Donut charts and their 3D variations, Radar and Scatter charts.
JavaScript Spline Chart by DHTMLX

Spline Chart

HTML Bar Chart by DHTMLX

Bar Chart

HTML Radar Chart by DHTMLX

Radar Chart

Scatter Chart JavaScript DHTMLX

Scatter Chart

Navigation Components: Menu, Ribbon, Sidebar, Toolbar

This group of JavaScript components shares a similar range of controls for website navigation: various buttons, navigation items, spacers, separators, titles, and input fields. The Tree collection enables developers to conveniently manage the controls and update them dynamically. Here is an example of a JavaScript ribbon toolbar:

JavaScript Ribbon Toolbar - DHTMLX

Form-Oriented Components: Calendar, ColorPicker, Combo, Form, Slider, TimePicker

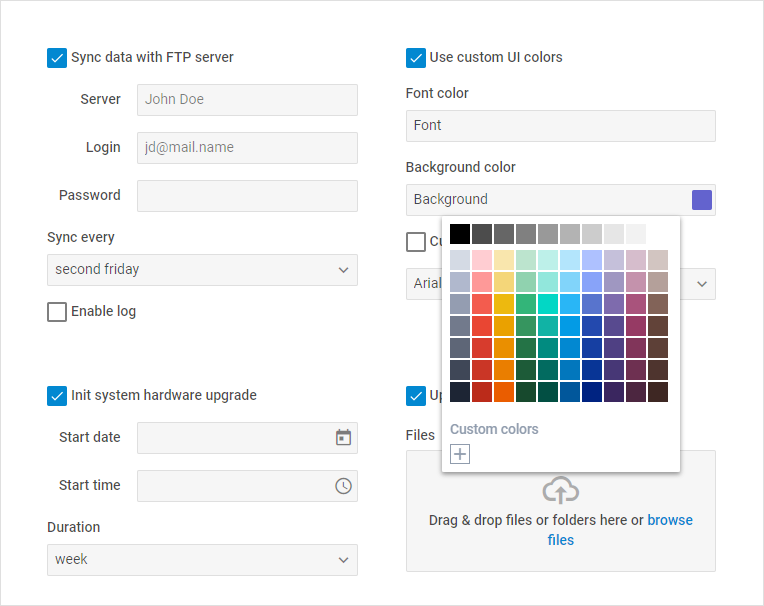
These components can assist you in building diverse interfaces for multiple purposes. However, we’ve put them in the form-oriented group of components, as they are a perfect fit for creating complex forms and can be easily integrated with each other. Here you can check how dhtmlxForm may look like with a colorpicker, calendar, time picker, and simple file uploader attached:

JavaScript Form by DHTMLX

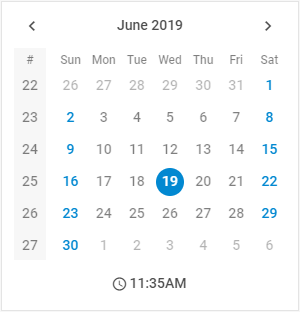
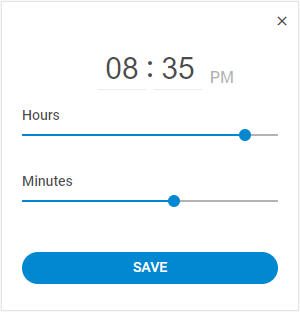
dhtmlxCalendar can also be integrated with a time picker, which we created on the basis of dhtmlxSlider component:

JavaScript Calendar by DHTMLX JavaScript time picker - DHTMLX

Helpers: Popup and Message (Alert, Confirm, Tooltip)

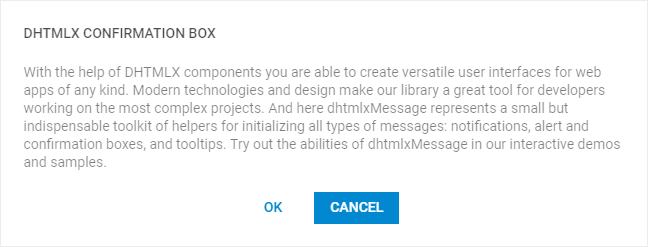
These are little helpers that are crucial for creating any web interface. They represent different types of dialog boxes: popup windows, message boxes for showing notifications, alerts, confirmations, and tooltips.

JavaScript Message Box by DHTMLX

Suite 6.0 vs The Previous Versions

Apart from the technologies described above, the new Suite 6.0 differs from the previous versions in size and components included.

The size of the newly released Suite 6.0 is 330KB, while its predecessor weighed around 1.3MB. The significant decrease in size contributes to building much faster web apps.

dhtmlxAccordion, dhtmlxCarousel, dhtmlxEditor, and dhtmlxTreeView are no longer independent components of the Suite library. Now you can easily create the accordion component using dhtmlxLayout. dhtmlxTree has taken over all of the features from dhtmlxTreeView. dhtmlxCarousel has been deprecated for lack of use cases in web apps. The editor component has been replaced by dhtmlxRichText, JavaScript rich text editor, with many more functions and possibilities.

Meanwhile, other components have been introduced in v6.0 – dhtmlxDatePicker and dhtmlxTimePicker. The datepicker represents the integration of dhtmlxCalendar with dhtmlxPopup. The timepicker is a separate component, which can be easily used together with the calendar, forms, and other components.

Moreover, other DHTMLX products such as Vault, RichText, and Spreadsheet are now compatible with Suite 6.0, as they are built on the basis of its components and share the same API. That means you can use all of them together with dhtmlxSuite in one web app with no trouble.

Maintenance of dhtmlxSuite 5.1

Despite the launch of dhtmlxSuite 6.0, the previous version of dhtmlxSuite 5.1 will still be maintained. We’ll continue to release updates with improvements and support our current clients and their projects based on the versions of DHTMLX UI library up to 5.1. In the near future, we’ll release an update of dhtmlxSuite v5.2.

The reason for the coexistence of the versions 5.1 and 6.0 is the absence of the straightforward migration path. Thus, we recommend our current clients to use dhtmlxSuite 6.0 for new projects focusing on modern browsers and technologies and leave versions up to 5.1 for existing projects or those where compatibility with older browsers is a necessity. Our technical specialists will support you in implementing the features you have in web apps built with the versions of Suite up to 5.1 using the new Suite 6.0 library.

dhtmlxSuite 6.0 Licensing and PRO Functionality

You may get acquainted with the whole library downloading dhtmlxSuite evaluation version and testing it for free for 30 days. During the evaluation period, you’re eligible to receive support from our technical specialists.

dhtmlxSuite is also available for open source projects under the GNU GPL v2 license and Standard edition.

Commercial projects require the paid license (Commercial, Enterprise or Ultimate depending on your needs) with Professional edition. PRO edition of dhtmlxSuite 6.0 offers a special module for processing data (parsing and serialization) in the XML format that can be used with data processing and visualization components: dhtmlxGrid, dhtmlxTree, dhtmlxTreeGrid, and dhtmlxCharts.

The TreeGrid component is available in PRO edition only as an extension of dhtmlxGrid.

All JavaScript UI components are delivered in one package, as they are all interlinked with each other and represent a comprehensive toolkit for building feature-rich web apps. However, you can still use and purchase the following components separately: dhtmlxGrid, dhtmlxTreeGrid, dhtmlxCharts, and dhtmlxCalendar.

We invite all our users and clients to download and evaluate the new version of Suite UI library 6.0 and leave your feedback. The trial period is free for 30 days. Our technical support team will assist you in every step of your work with the updated components.

Related Material:

The post dhtmlxSuite 6.0 Rolled Out: Large-Scale Update of the JavaScript UI Library appeared first on DHTMLX Blog.

Maintenance Release: dhtmlxGantt 6.1.7 and dhtmlxScheduler 5.2.1

$
0
0

Here comes a new pack of June maintenance releases for our scheduling and planning components: JavaScript Scheduler and JavaScript Gantt chart. The whole list of improvements is available in the documentation.

What’s New in dhtmlxScheduler 5.2.1

June 11, 2019

  • (Fixed) The issue with load data type detection in IE11
  • (Fixed) timeline.scrollTo method in timeline without horizontal scrollbar
  • (Fixed) Not working showEvent method in the Timeline view
  • (Fixed) Incorrect behavior of vertical scroll in scrollable timeline with smart_rendering:false
  • (Fixed) Incorrect event position in the multiday units view with the multisection extension when the step option is specified
  • (Fixed) Incorrect size of some events in Daily Timeline

Learn more in the documentation >

What’s New in dhtmlxGantt 6.1.7

June 25, 2019

  • (Fixed) Incorrect behavior of getClosestWorkTime
  • (Fixed) Issue with the autoscroll which happened after toggling visibility of the timeline
  • (Fixed) Bug in the Multiselect extension which caused selected tasks to lose highlight after chart repaint
  • (Fixed) Script error which happened after vertical drag-and-drop if smart rendering and keyboard navigation extensions were enabled
  • (Fixed) Incorrect behavior which happened when users tried to switch between inline editors using the Tab key if some columns of the grid were hidden
  • (Fixed) Unexpected behavior which prevented the lightbox and inline editors from overriding constraint dates

Learn more in the documentation >

We invite you to test the updated libraries:

Current clients may download the latest versions in their Client Area.

The post Maintenance Release: dhtmlxGantt 6.1.7 and dhtmlxScheduler 5.2.1 appeared first on DHTMLX Blog.

dhtmlxGantt 6.2 Minor Update: Boosting Gantt Chart Performance, Zooming by Mouse Wheel, and Much More

$
0
0

Despite summer being traditionally the holiday season, the development of JavaScript components never stops at DHTMLX. Our dev team delivered an extensive update of the JavaScript Gantt library hugely boosting its performance and presenting new features. Now our Gantt together with its resource panel is much more rapid than ever before. We also added such new possibilities as zooming by mouse wheel, creating tasks by drag-n-drop right from the timeline, and expanding split tasks. On top of all, we improved the work of inline editors, cleaned up the API and fixed some smaller issues.

Try out all the new features in a free 30-day evaluation version >

Boosting Gantt Chart Performance

The smart rendering extension underwent a major update, which boosted Gantt chart performance, in resource panels in particular. Now the extension is included in the main component by default.

In practice, it means that:
1) You should see a major performance improvement for large charts, especially if you use the resource panel.
2) We removed dhtmlxgantt_smart_rendering.js extension from the package, as it became redundant.
3) Using static_background config is no longer necessary. Now a default background is rendered with the ability to highlight individual columns and cells of the timeline.

No specific settings are now needed to address the rendering performance. Everything should work blazingly fast out of the box.

Surely, there is still room for further improvements, and we’re going to work on accelerating dhtmlxGantt in future updates.

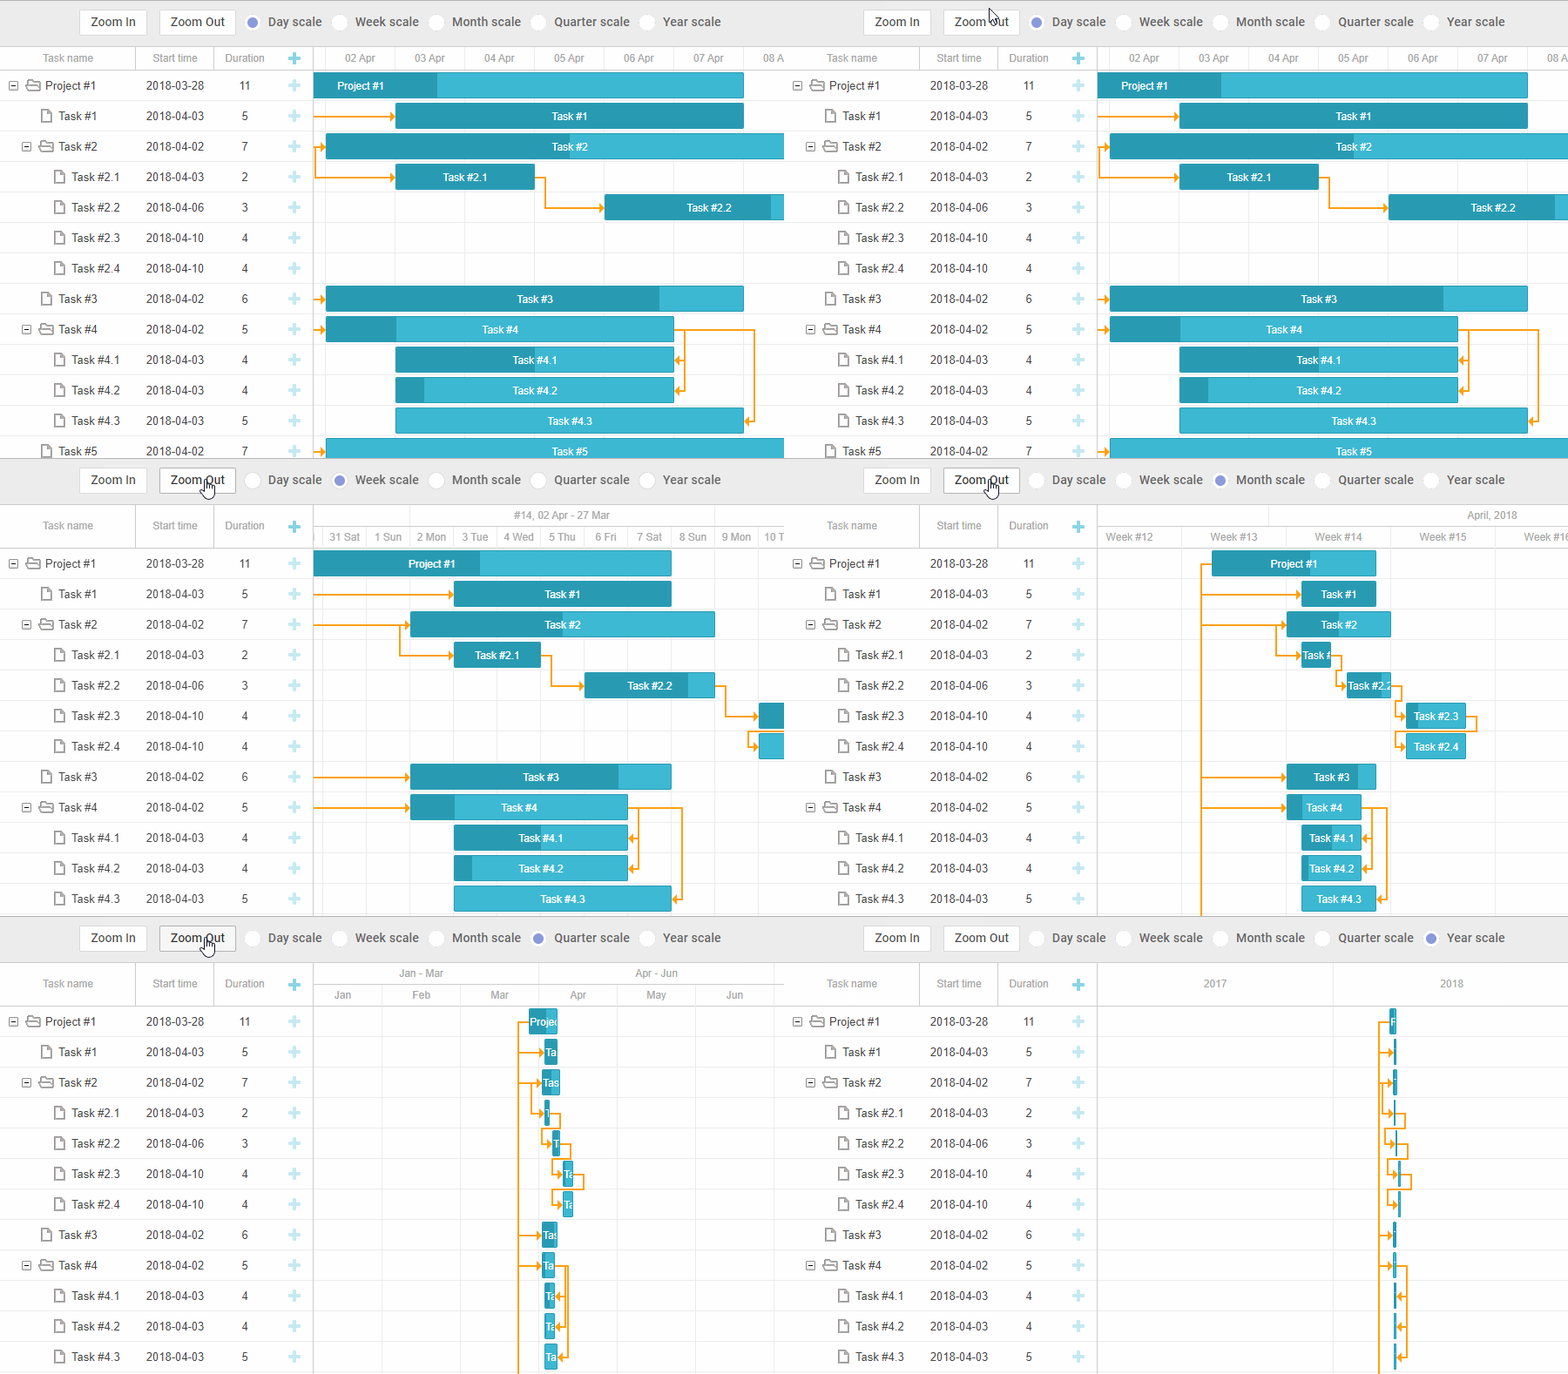
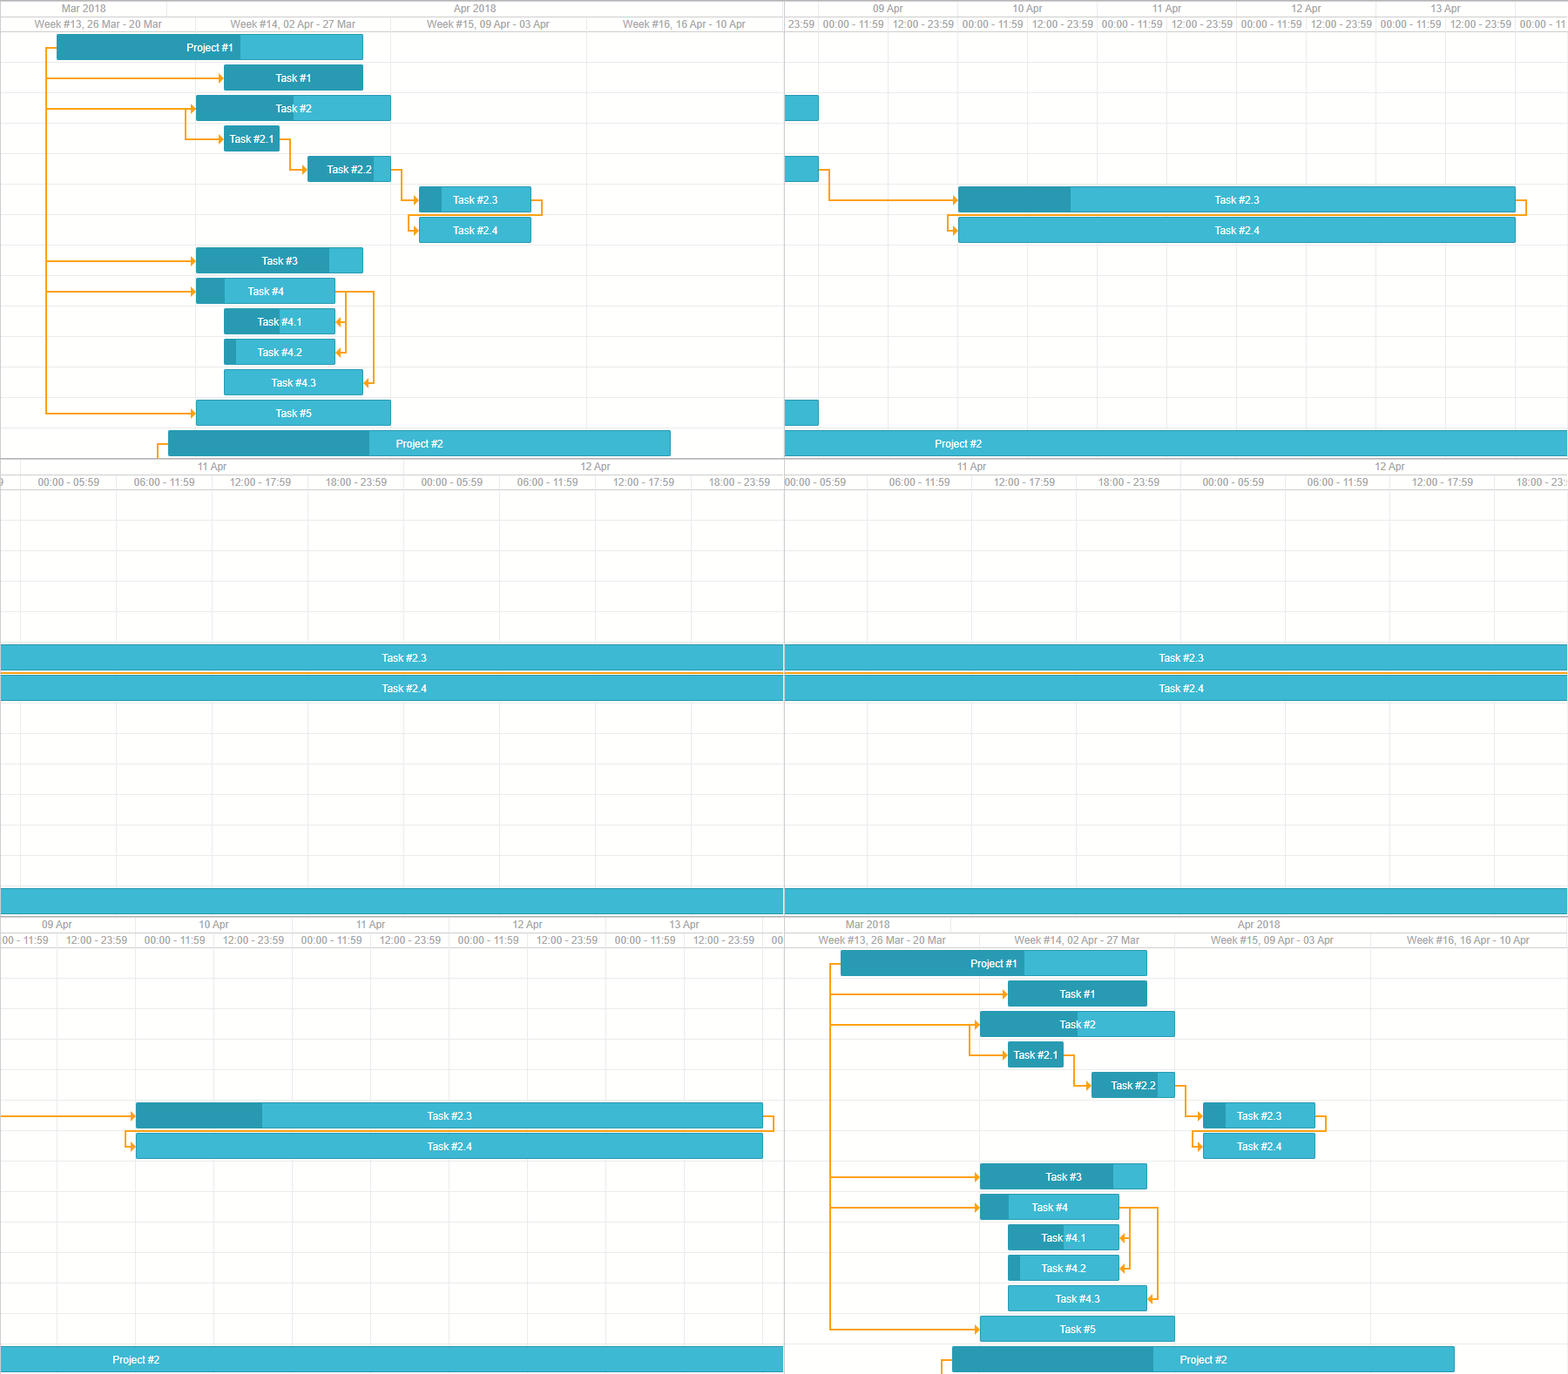
New Module for Timeline Zooming

In v6.2 the zooming feature became much more intuitive and user-friendly both for developers and end users. We introduced a new zooming module, which provides a simple API for managing zoom levels of the Gantt chart.

Firstly, there is an ability to set up the available zoom levels and manage them using simple Zoom In and Zoom Out methods. To define the available zoom levels:

const zoomModule = gantt.ext.zoom;

zoomModule.init({
    levels: [
      {
        name:"day",
        scale_height: 27,
        min_column_width:80,
        scales:[
            {unit: "day", step: 1, format: "%d %M"}
        ]
      },
      {
         name:"week",
         scale_height: 50,
         min_column_width:50,
         scales:[
          {unit: "week", step: 1, format: function (date) {
           var dateToStr = gantt.date.date_to_str("%d %M");
           var endDate = gantt.date.add(date, -6, "day");
           var weekNum = gantt.date.date_to_str("%W")(date);
           return "#" + weekNum + ", " + dateToStr(date) + " - " + dateToStr(endDate);
           }},
           {unit: "day", step: 1, format: "%j %D"}
         ]
       },
       {
         name:"month",
         scale_height: 50,
         min_column_width:120,
         scales:[
            {unit: "month", format: "%F, %Y"},
            {unit: "week", format: "Week #%W"}
         ]
        },
        {
         name:"quarter",
         height: 50,
         min_column_width:90,
         scales:[
          {unit: "month", step: 1, format: "%M"},
          {
           unit: "quarter", step: 1, format: function (date) {
            var dateToStr = gantt.date.date_to_str("%M");
            var endDate = gantt.date.add(gantt.date.add(date, 3, "month"), -1, "day");
            return dateToStr(date) + " - " + dateToStr(endDate);
           }
         }
        ]},
        {
          name:"year",
          scale_height: 50,
          min_column_width: 30,
          scales:[
            {unit: "year", step: 1, format: "%Y"}
        ]}
    ]
});

And to manage zoom levels:

zoomModule.setLevel("year");

// or
zoomModule.zoomIn();

// or
zoomModule.zoomOut();

Gantt zoom levelsCheck the sample >

Secondly, and most importantly, end users can switch between Gantt chart scales just with the help of the mouse wheel:
Gantt zoom by mouse wheel Check the sample >

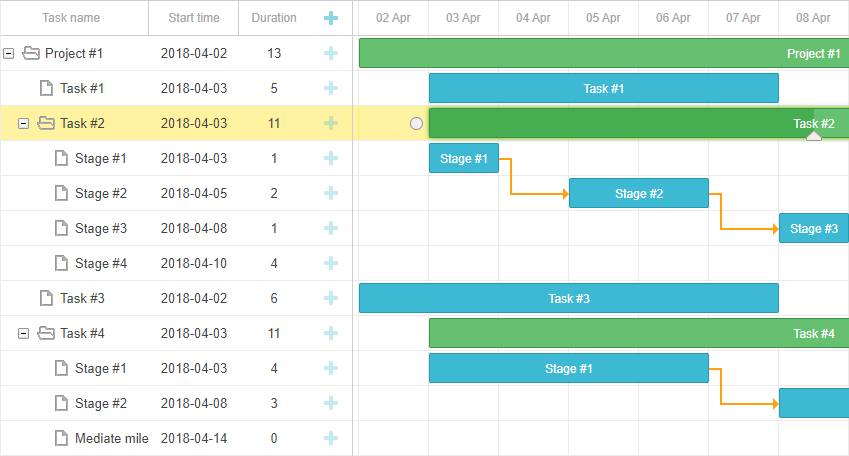
Expanding and Collapsing Split Tasks [PRO]

With v6.2 end users can expand and collapse split tasks from the interface of the grid in order to view them as separate subtasks and manage them conveniently. This feature is turned on with the help of a new configuration option open_split_tasks:

gantt.config.open_split_tasks = true;

Expanding split tasksCheck the sample >

Improved Drag-n-Drop

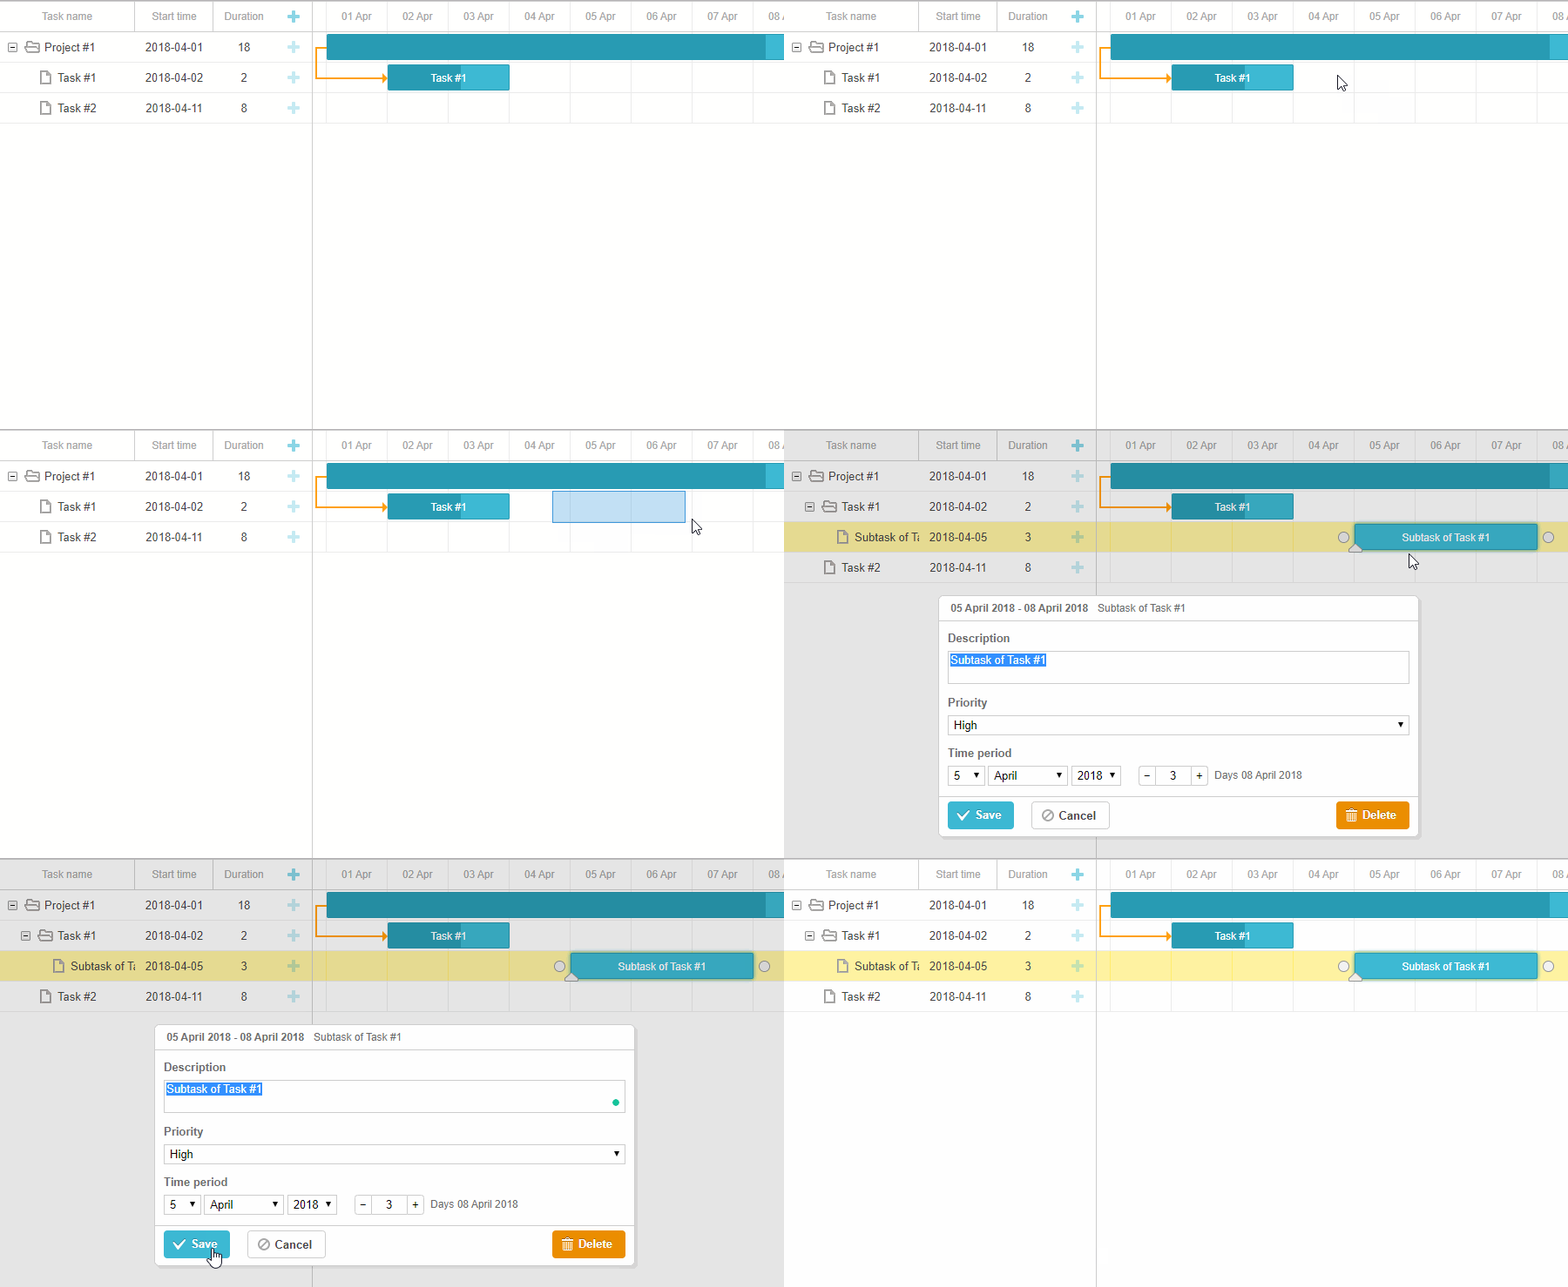
We are always looking for ways of improving the user experience of dhtmlxGantt. As a part of this endeavor, we introduced a module with an updated drag-n-drop feature. Using this module, you can create new tasks directly in the timeline area of the Gantt chart.

Creating new Gantt tasksCheck the sample >

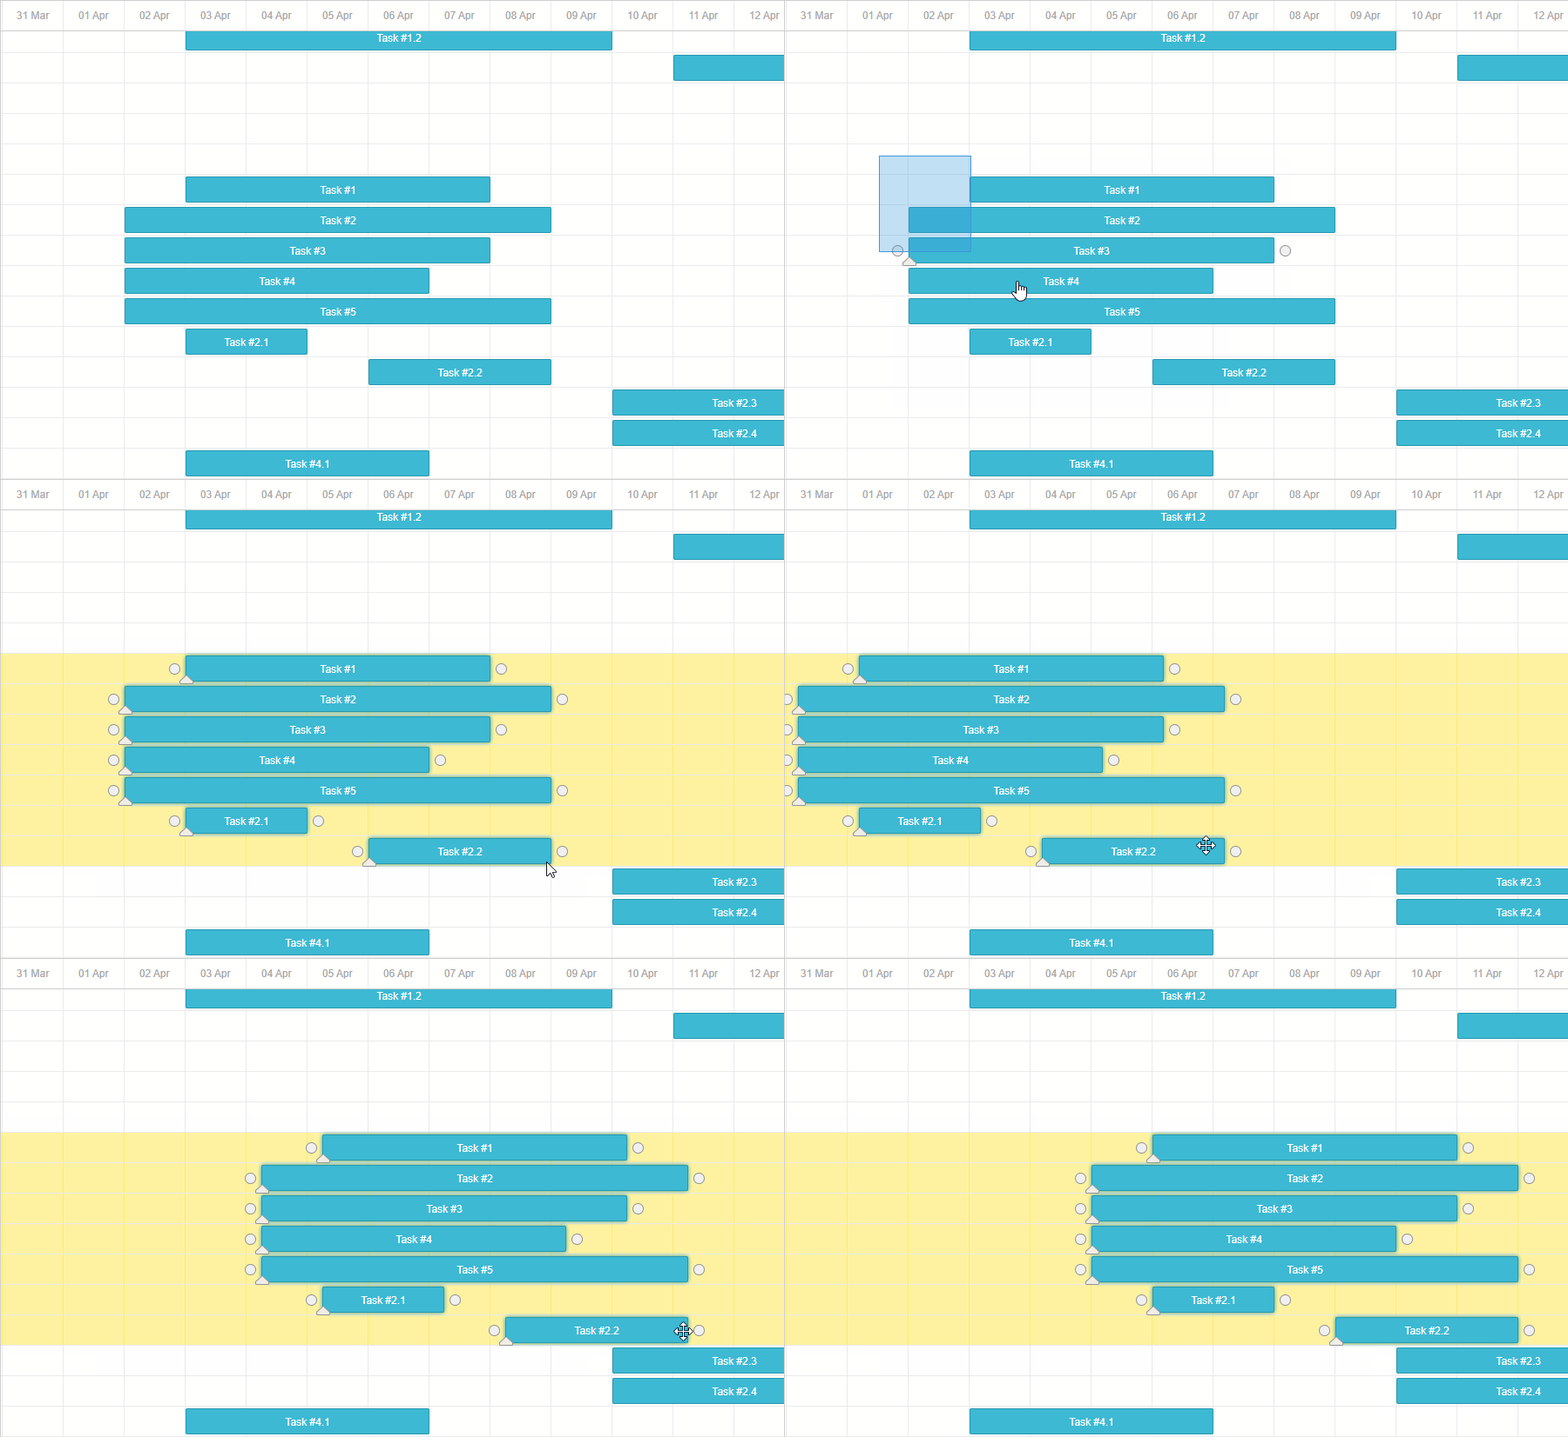
Besides, the new module provides an API that you can use to bind drag-n-drop to any behavior you need like selecting multiple tasks in order to move them across the timeline, adding a note to the area in the timeline, creating split tasks, setting time of unscheduled tasks, etc.

Selecting multiple tasks and moving them:
Multiple selection of Gantt tasksCheck the sample >

Creating subtasks of split tasks using drag-n-drop in the timeline area:
Creating Gantt tasks by drag-n-drop
Check the sample >

Inline Editors Update

Another UX improvement concerns the work of inline editors. We changed their default behavior following the patterns of popular apps like MS Project. Now changing the start date triggers a task to move, changing the end date modifies the duration of a task, and changing the duration modifies the end date. Learn more in our docs >

However, you are free to stick to the old behavior of inline editors with the help of the following configuration option gantt.config.inline_editors_date_processing:

gantt.config.inline_editors_date_processing = "keepDuration";
Enhanced Setup of the Timeline Scale

The update introduced an easier way to set up scales of the timeline by reducing the number of configuration options to one gantt.config.scales. Now developers can configure all the available scales using this configuration option alone:

gantt.config.scales = [
    {unit: "month", step: 1, format: "%F, %Y"},
    {unit: "week", step: 1, format: weekScaleTemplate},
    {unit: "day", step: 1, format: "%D", css:daysStyle }
];

Old settings will be deprecated. However, you may still keep on using them in your current projects, although we recommend switching to the updated settings in new projects.

API Update and Other Improvements

Besides the changes in the API described above, we replaced several other configs and templates with more intuitive ones. Please check the details in the migration guide >

Other minor issues were fixed in v6.2:

  • Multiple tasks highlighting resets after rendering
  • Script error when destroying Gantt from data processor handler

We hope that the update of dhtmlxGantt 6.2 will come in useful in your projects. You may get the latest trial version on the download page. Current clients will receive the updated package in their Client Area.

We’ll be looking forward to your feedback! Stay tuned!

Related Materials:

dhtmlxSuite 5.2: Minor Update for Current Clients

$
0
0

We’re happy to announce to our customers that our JS UI library dhtmlxSuite 5 received a minor update 5.2 with a wide range of enhancements. The update delivered new API methods and events for the following components: Chart, Form, Grid, Toolbar, and TreeView. Besides, from now on you can use SVG images for the Form, Calendar, and Combo. Let’s dive deeper into the release details.

dhtmlxChart Update

V5.2 introduced a more accurate approach for setting the step parameter of the Y-axis with the help of the decimalDigits parameter. Additionally, we provided a new method for removing all the series in dhtmlxChart – clearSeries.

dhtmlxForm Update

A new clear method of dhtmlxForm enables developers to clear all the fields in a form on the fly. Besides, we restored the setItemHeight method, which allows you to easily set the height of the textarea element.

dhtmlxGrid Update

V5.2 gives more flexibility working with columns, rows, and filters of the grid. A new method resetColumnsOrder allows storing the order of columns after changing it instead of keeping the default one. Now it’s also possible to remove the selection of a specific row by its id with the help of the unselectRowByID method. Another new method introduced with this update is getFilterElementByID. It enables you to get the filter object situated in a particular column by its id. For example:

// get filter object placed in the header of the column with id "title"
var filterObject = myGrid.getFilterElementById("title");
dhtmlxToolbar Update

We supplied input controls of the toolbar with the onValueChange event triggered by a user while changing the value of a slider item. For instance:

myToolbar.attachEvent("onValueChange", function(id, value){
    //your code here
});
dhtmlxTreeView Update

We also added a new event in dhtmlxTreeView – onBeforeSelect, which fires before an item is selected like that:

myTreeView.attachEvent("onBeforeSelect", function(id){
    // your code here
});

Apart from the newly added methods and events, we made some other improvements in all the components. You can get acquainted with the whole list of updates in the documentation.

Suite 5 vs Suite 6

Suite 5 is a predecessor of dhtmlxSuite 6 released on June 21, 2019. Below you can find a detailed comparison of these versions.

dhtmlxSuite 5:

  • Weighs 1.2MB
  • Supports older browsers like IE8+
  • Has 4 predefined skins
  • Makes use of connectors for server-side integration
  • Supports TypeScript (TypeScript definitions are included in the package)

dhtmlxSuite 6:

  • Weighs 330KB
  • Supports modern browsers (IE11+)
  • Compatible with React, Angular, and Vue.js
  • Based on the Material style
  • Fully and easily customizable via CSS
  • Makes use of all modern architectural styles for data transfer between the server and the client
  • Supports TypeScript (TypeScript definitions will be included in the package soon)

Suite 5 has been under active development for more than 10 years. It’s rich in functionality and, besides, offers several helpers: Visual Designer tool for UI prototyping and Skin Builder for applying the predefined skins. Meanwhile, Suite 6 represents a fresh start and a new direction in the development of DHTMLX UI components in order to make them modern and easy to use with the latest technologies. There is no backward compatibility between these two versions. Suite 6 hasn’t comprised all the features of Suite 5 yet, but some of the main features lacking in Suite 6 (e.g. drag-n-drop and editing features in Grid and TreeGrid) will be added soon.

We encourage our current clients to keep on using Suite 5 in their ongoing projects, as we’ll support this version of DHTMLX UI library and provide further updates. You may find the latest version 5.2 in your Client Area.

Related Materials:

The post dhtmlxSuite 5.2: Minor Update for Current Clients appeared first on DHTMLX Blog.

How to Filter Tasks in a JavaScript Gantt – DHTMLX Video Tutorial

$
0
0

Here we go with a new video tutorial about JavaScript Gantt configuration. We’ll learn a common approach to implementing filtering and searching for tasks in the grid of dhtmlxGantt:

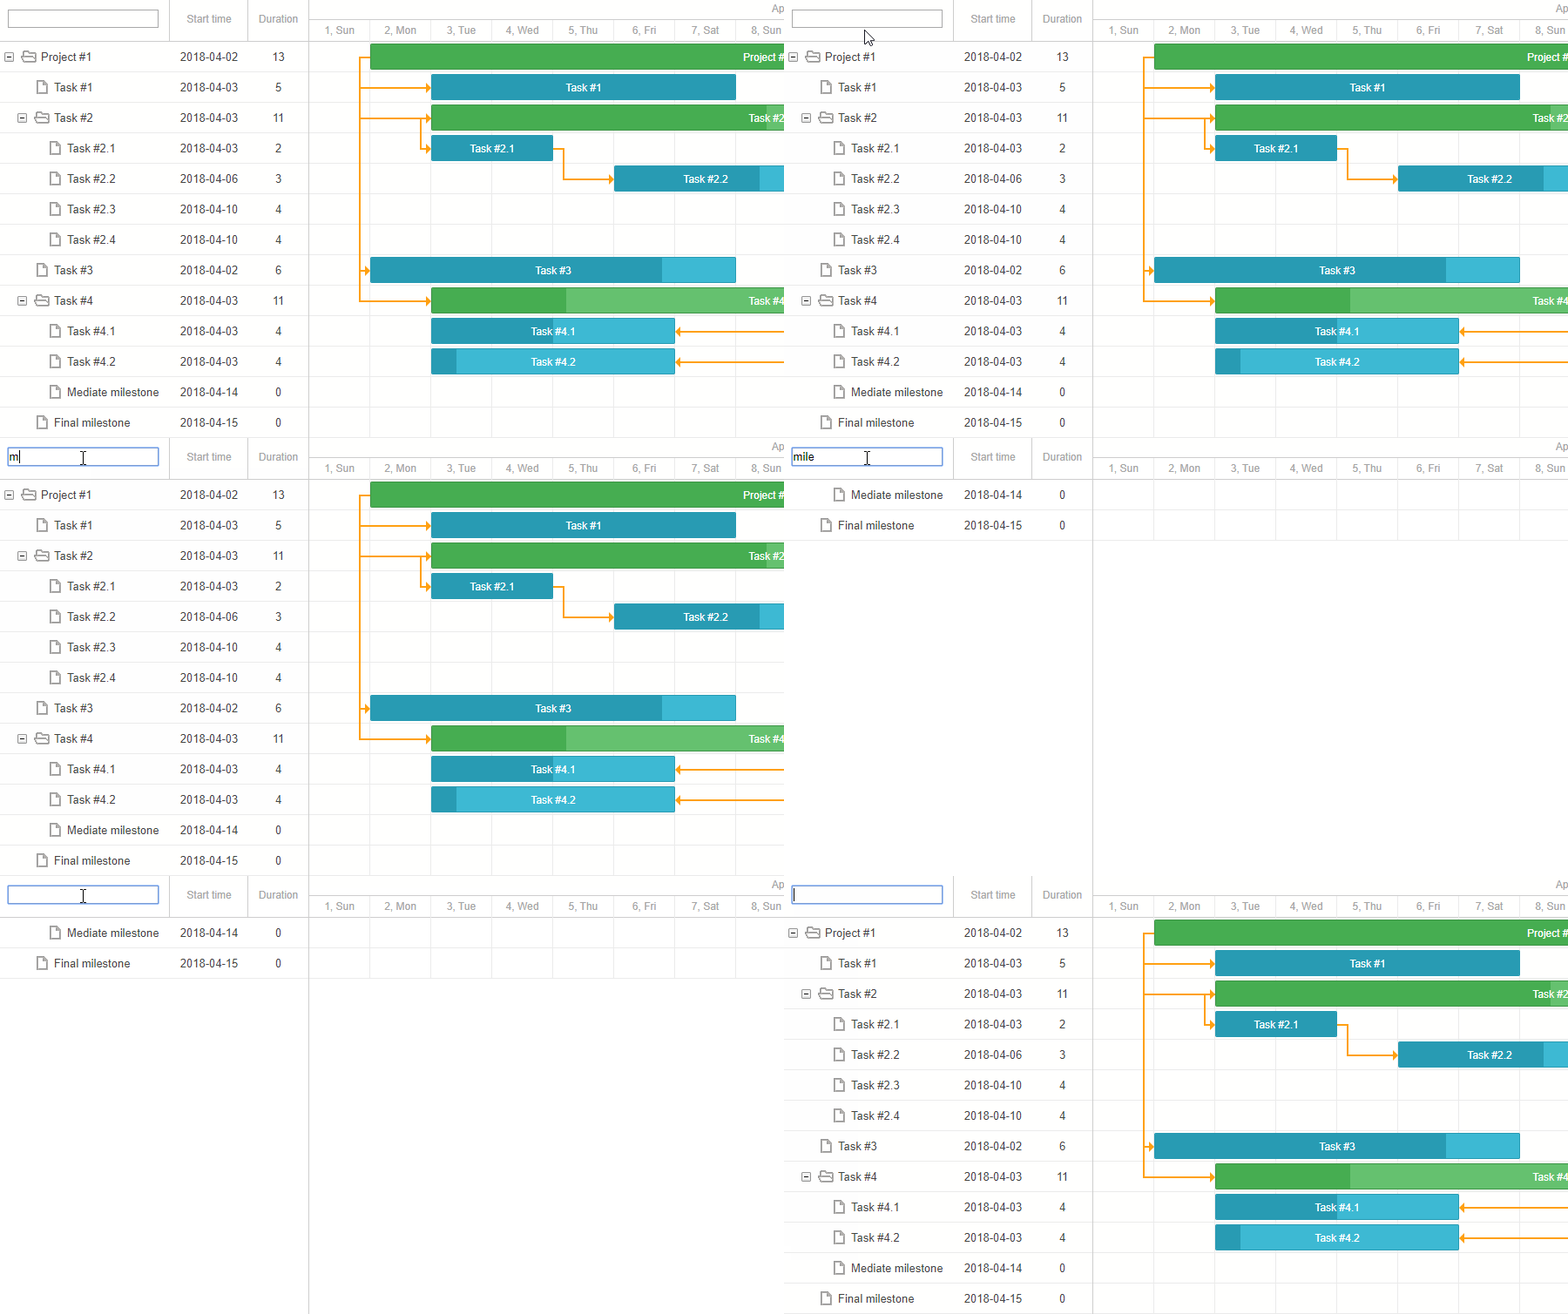
Let’s take a look at the example of a basic text filter. A user types something – and we display only the tasks that match the selection:
Filtering tasks in DHTMLX Gantt

Such filters consist of two parts:

  • the UI control that allows a user to select the filter criteria
  • the code that will manage the visibility of rows in Gantt

We already know how to add UI controls, and we know that we’ll update filters on the user input.

Now, how do we filter tasks in Gantt?

There is no filter tasks method in dhtmlxGantt. Instead, there is an API event called onBeforeTaskDisplay:

gantt.attachEvent("onBeforeTaskDisplay", function(id, task){
    if (task.priority == "high"){
        return true;
    }
    return false;
});

Check the API in the documentation >

This event is called for each task during a complete repaint of Gantt data. We can add a handler for this event to our code, and skip rendering of tasks that don’t match the filter value.

To begin with, we add a text field to the grid header:

var textFilter = "<input data-text-filter type='text' oninput='gantt.$doFilter(this.value)'>"
  gantt.config.columns = [
    {name: "text", label: textFilter, tree: true, width: '*', resize: true},
    {name: "start_date", align: "center", resize: true},
    {name: "duration", align: "center"}
  ];

Inside the oninput handler we’ll store the current value of the filter and trigger the repaint of the Gantt using the gantt render method:

var filterValue = "";
  var delay;
  gantt.$doFilter = function(value){
    filterValue = value;
    clearTimeout(delay);
    delay = setTimeout(function(){
      gantt.render();
      gantt.$root.querySelector("[data-text-filter]").focus();

    }, 200)
  }

The gantt render method causes a complete repaint of the Gantt chart, during which the onBeforeTaskDisplay event will be called for each task. Then we check whether the task matches the filter criteria, and decide whether to show it or not.

  gantt.attachEvent("onBeforeTaskDisplay", function(id, task){
   if(!filterValue) return true;

    var normalizedText = task.text.toLowerCase();
    var normalizedValue = filterValue.toLowerCase();
    return normalizedText.indexOf(normalizedValue) > -1;
  });

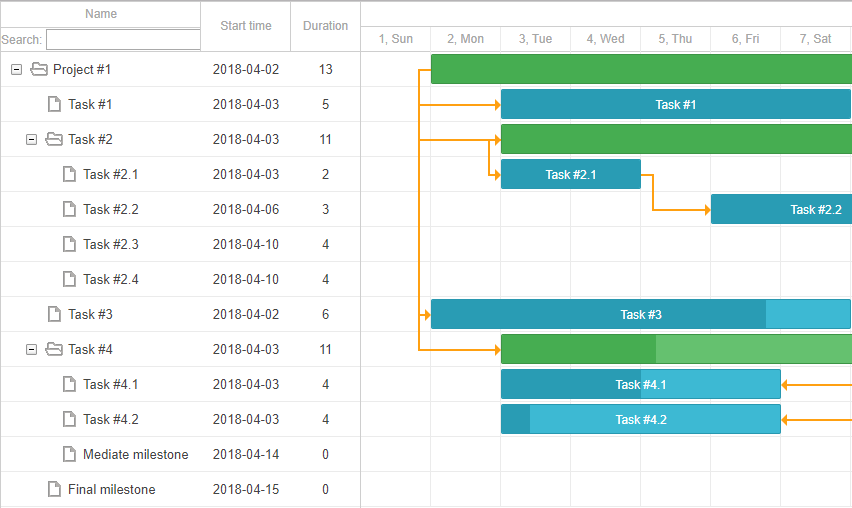
At this stage, you may want to have a multiline header in your grid, for example, in order to show a column name above your filter.
Multiline headers in DHTMLX Gantt
The bad news is that Gantt doesn’t have a built-in config for multiline headers. But we can bypass it in the same way as we added the filter in the first place using custom HTML content. We can display multiple rows inside the column label:

var scaleHeight = gantt.config.scale_height;
  var textFilter = [
        "<div class='gantt-sub-header' style='line-height:"+scaleHeight/2+"px'>",
        "<div>Name</div>",
        "<div>Search: <input data-text-filter type='text' oninput='gantt.$doFilter(this.value)'></div>",
        "</div>"
    ].join("");

Implementing col span or row span won’t be so trivial, so hopefully, you won’t need it.

We invite you to try filtering tasks yourself building your own JavaScript Gantt with the help of our free evaluation version. Follow the steps described in this article and our video tutorial or consult our technical support team if any questions arise.

Enjoy your Gantt and stay tuned for future tutorials!

The post How to Filter Tasks in a JavaScript Gantt – DHTMLX Video Tutorial appeared first on DHTMLX Blog.

Customer Spotlight: dhtmlxLayout and dhtmlxGrid for CESC-IT

$
0
0

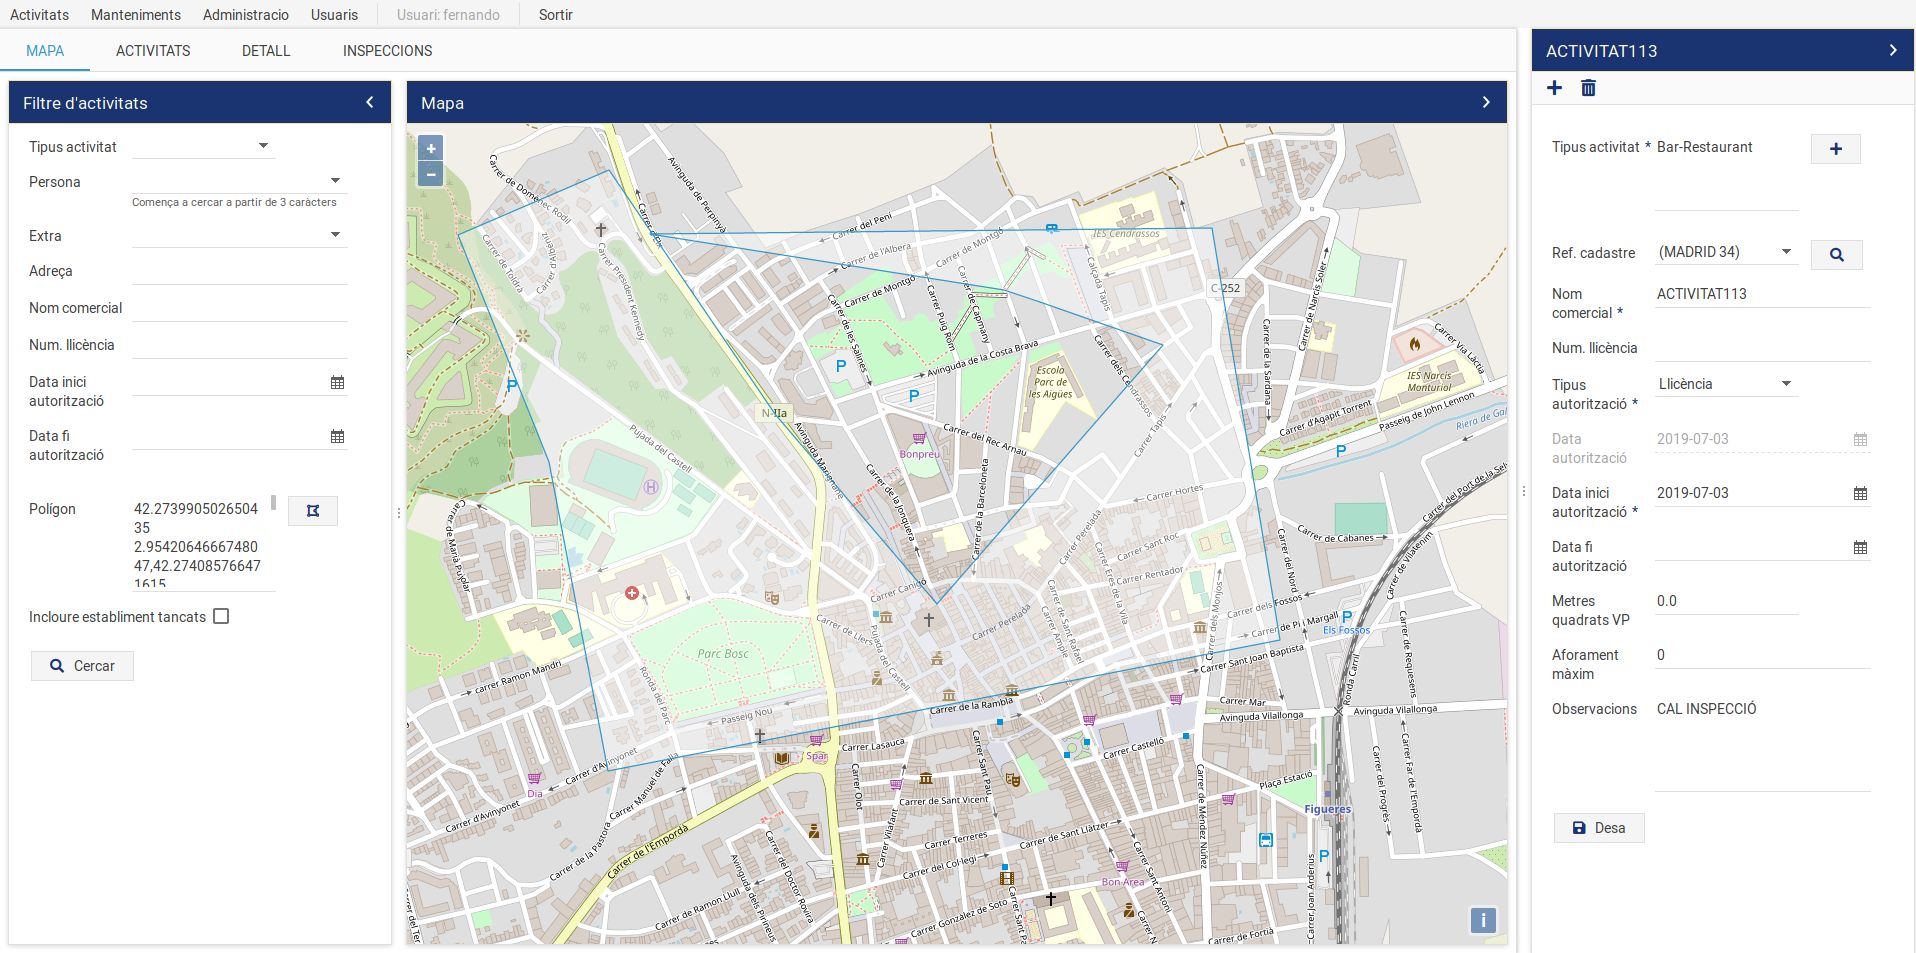
This time CESC-IT, software company from Catalonia, will tell us about their experience integrating the UI components – Layout and Grid – into their software solution for public administration EGUS.

EGUS is a multilanguage software solution designed for the departments of public administration responsible for the registration of municipal activities; town councils, police forces, etc.

The software allows the user to manage the commercial activities located within the limits of a municipality in real-time and makes them visible in a GIS map, so they can be fastly located.

It also allows creating a registry of relevant data like license number or capacity.
Furthermore, the user can store data from establishments, individuals or legal entities related to the activity, incidents and if necessary, attach documentation about them.

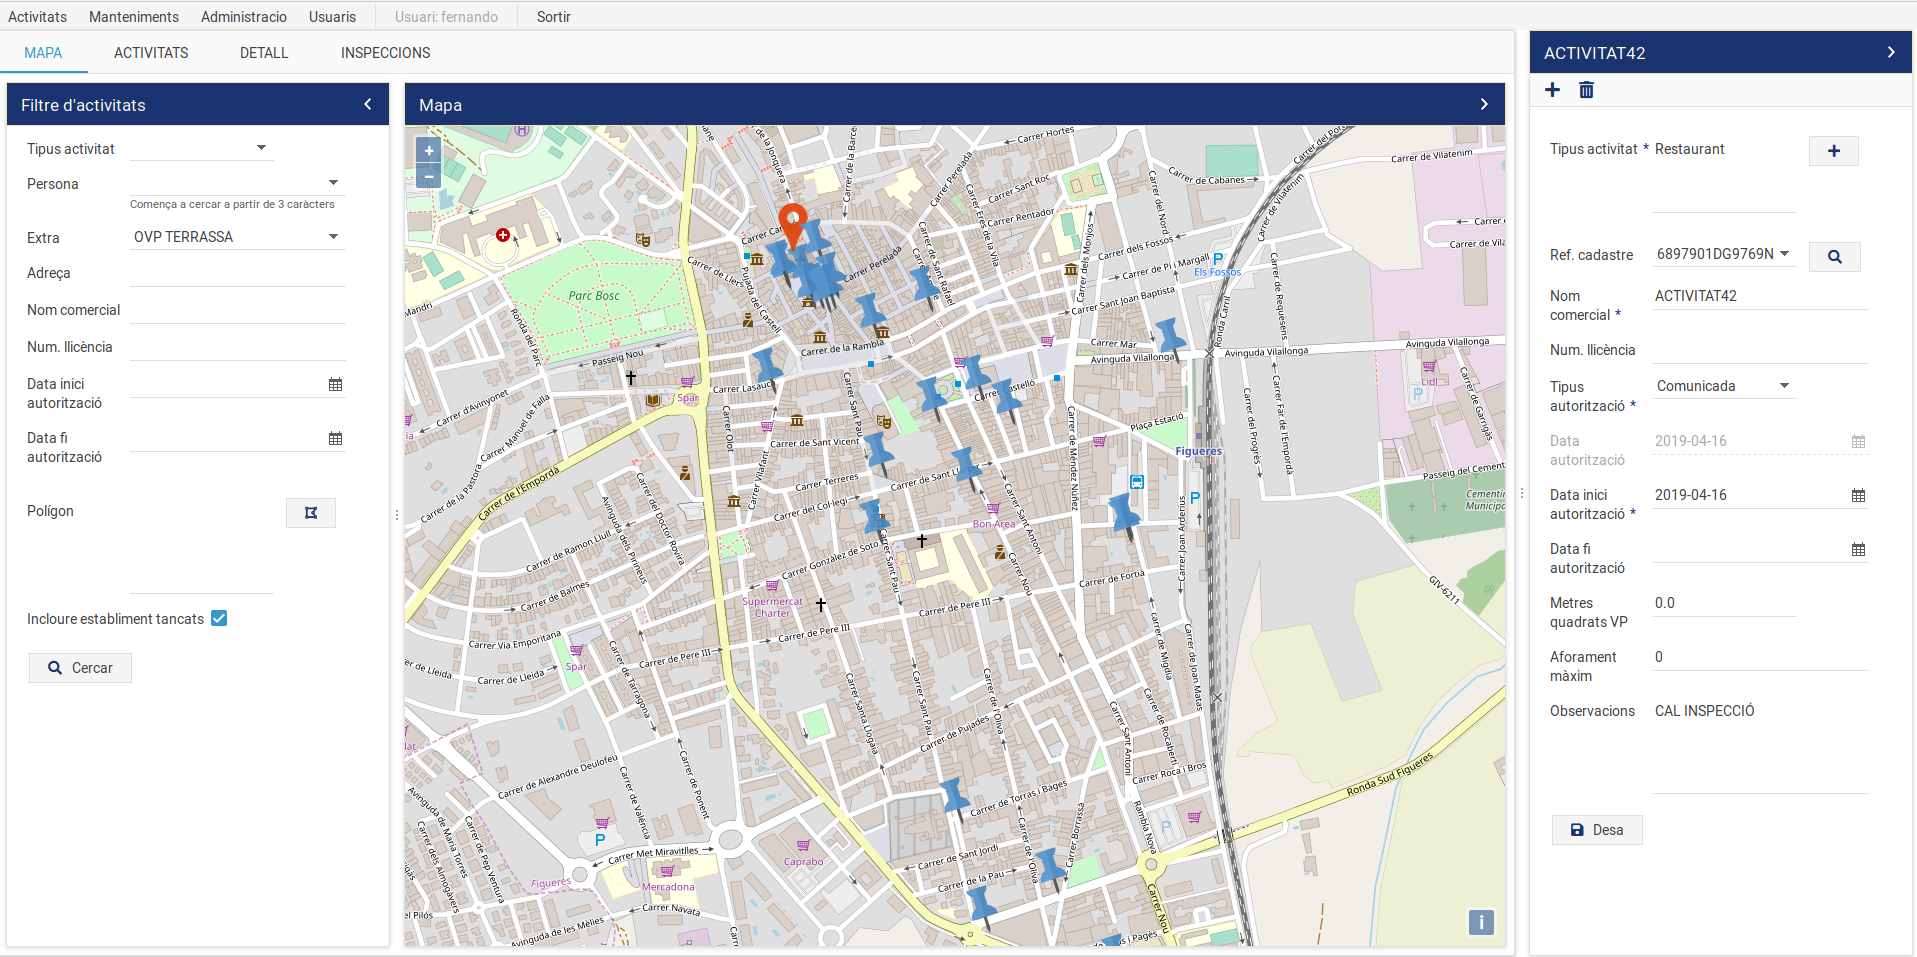
In order to achieve this challenge, we have integrated OpenLayers to dhtmlx by developing a Javascript language software solution, based on Java Server technology + html5 + DHTMLX with its components of LAYOUTS and DATAGRIDPRO.

eGus by CESC IT with DHTMLX Layout and Grid

We wanted to have the server data displayed on a GIS map and that with the map on the screen the user could filter activities faster, for example; by typology, date and/or polygon selection, obtaining geolocated search data on the map in the form of activities.

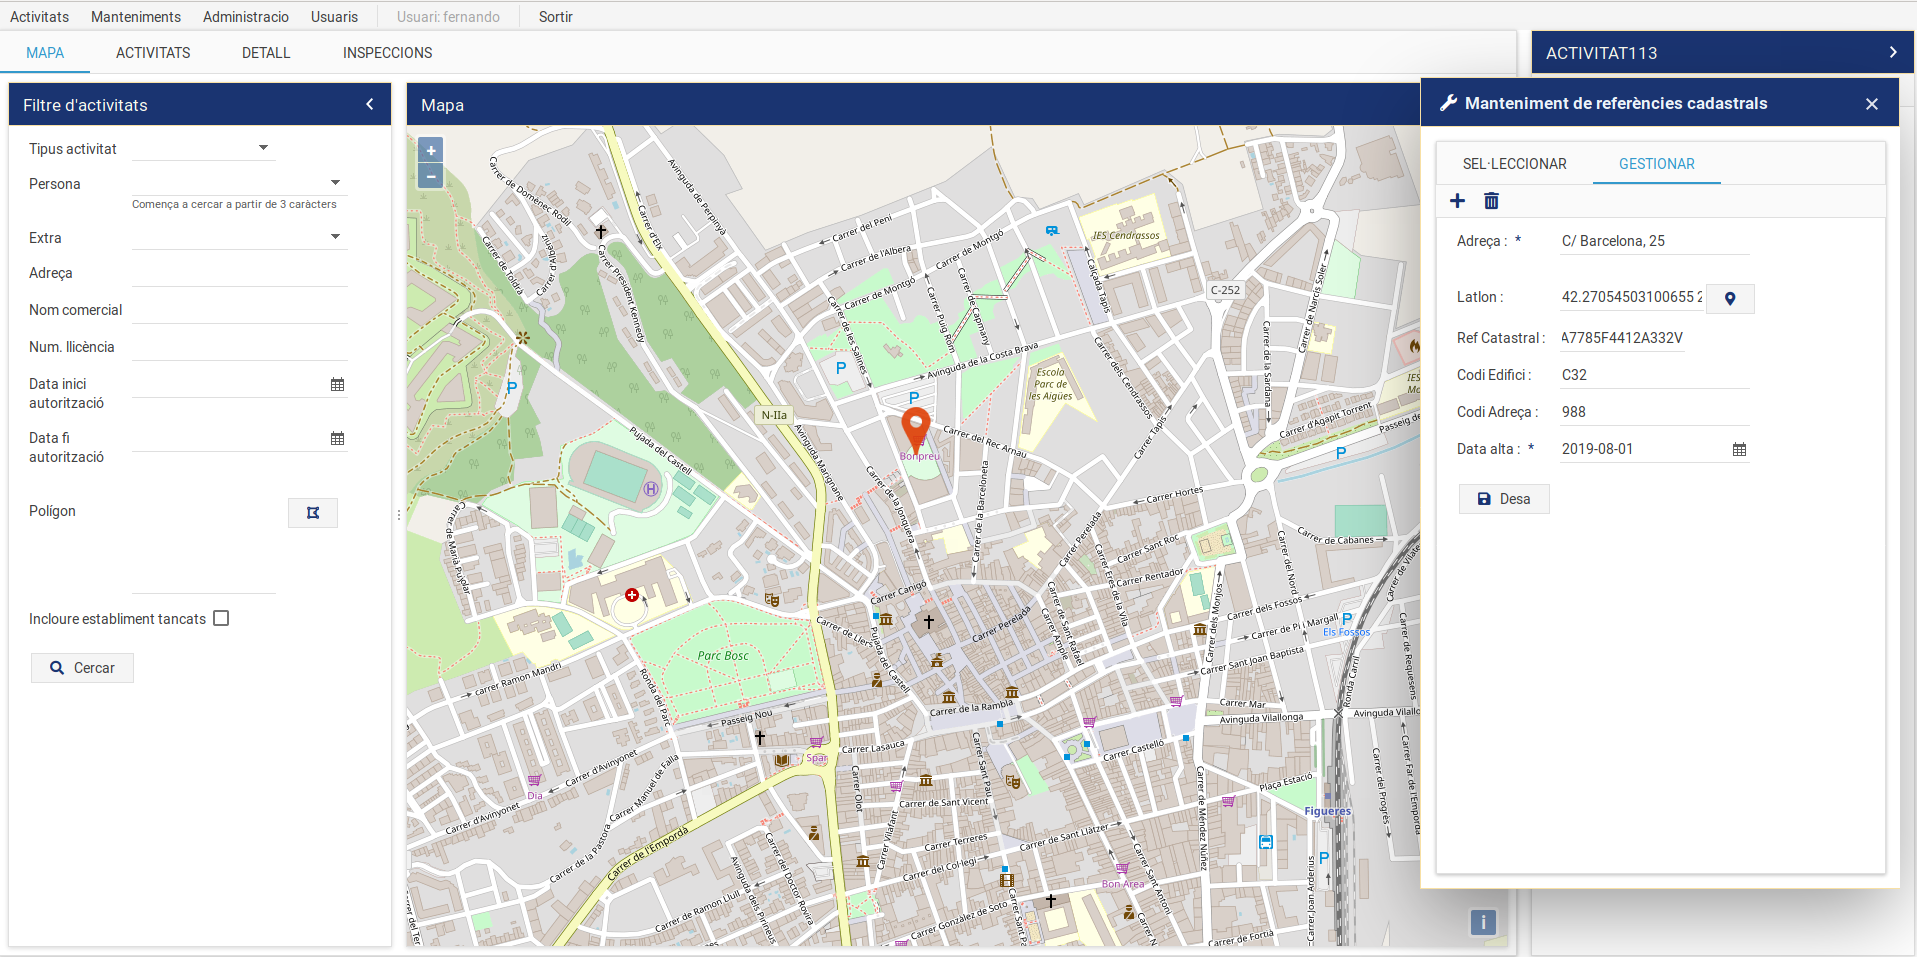
eGus by CESC-IT with DHTMLX Layout and Grid

The components of Layout + Datagridpro have allowed us to work with grids by grouping them according to applied filters. By this way, we give the users a great deal of power so that they can have immediate results, without overloading the server with new requests in the database. In conjunction with dhtmlxGridpro, we have integrated Openlayers to display the data on a GIS map, and this component has controls to show or delete lines of information according to interests in real-time.

eGus by CESC-IT with DHTMLX Layout and Grid

Great thanks to the developers of EGUS from CESC-IT for sharing their experience with us!

If you’d like your story to be highlighted on our blog, feel free to submit it here.

The post Customer Spotlight: dhtmlxLayout and dhtmlxGrid for CESC-IT appeared first on DHTMLX Blog.

dhtmlxSuite 6.1 Minor Update: Multiselection, Enhanced Drag-n-Drop and Editing Features

$
0
0

It’s been a month and a half since the large-scale update of the whole JavaScript UI library DHTMLX Suite v6.0. We’ve been gathering your feedback, prioritizing features for future releases, and working hard to deliver the next update 6.1. And now our minor release brings out editing for dhtmlxGrid and dhtmlxTree, multiselection and drag-n-drop of multiple items and inline editing in dhtmlxList and dhtmlxDataView as well as a range of other essential features for building top-notch user interfaces.

dhtmlxGrid New Features and Updates
Data Editing

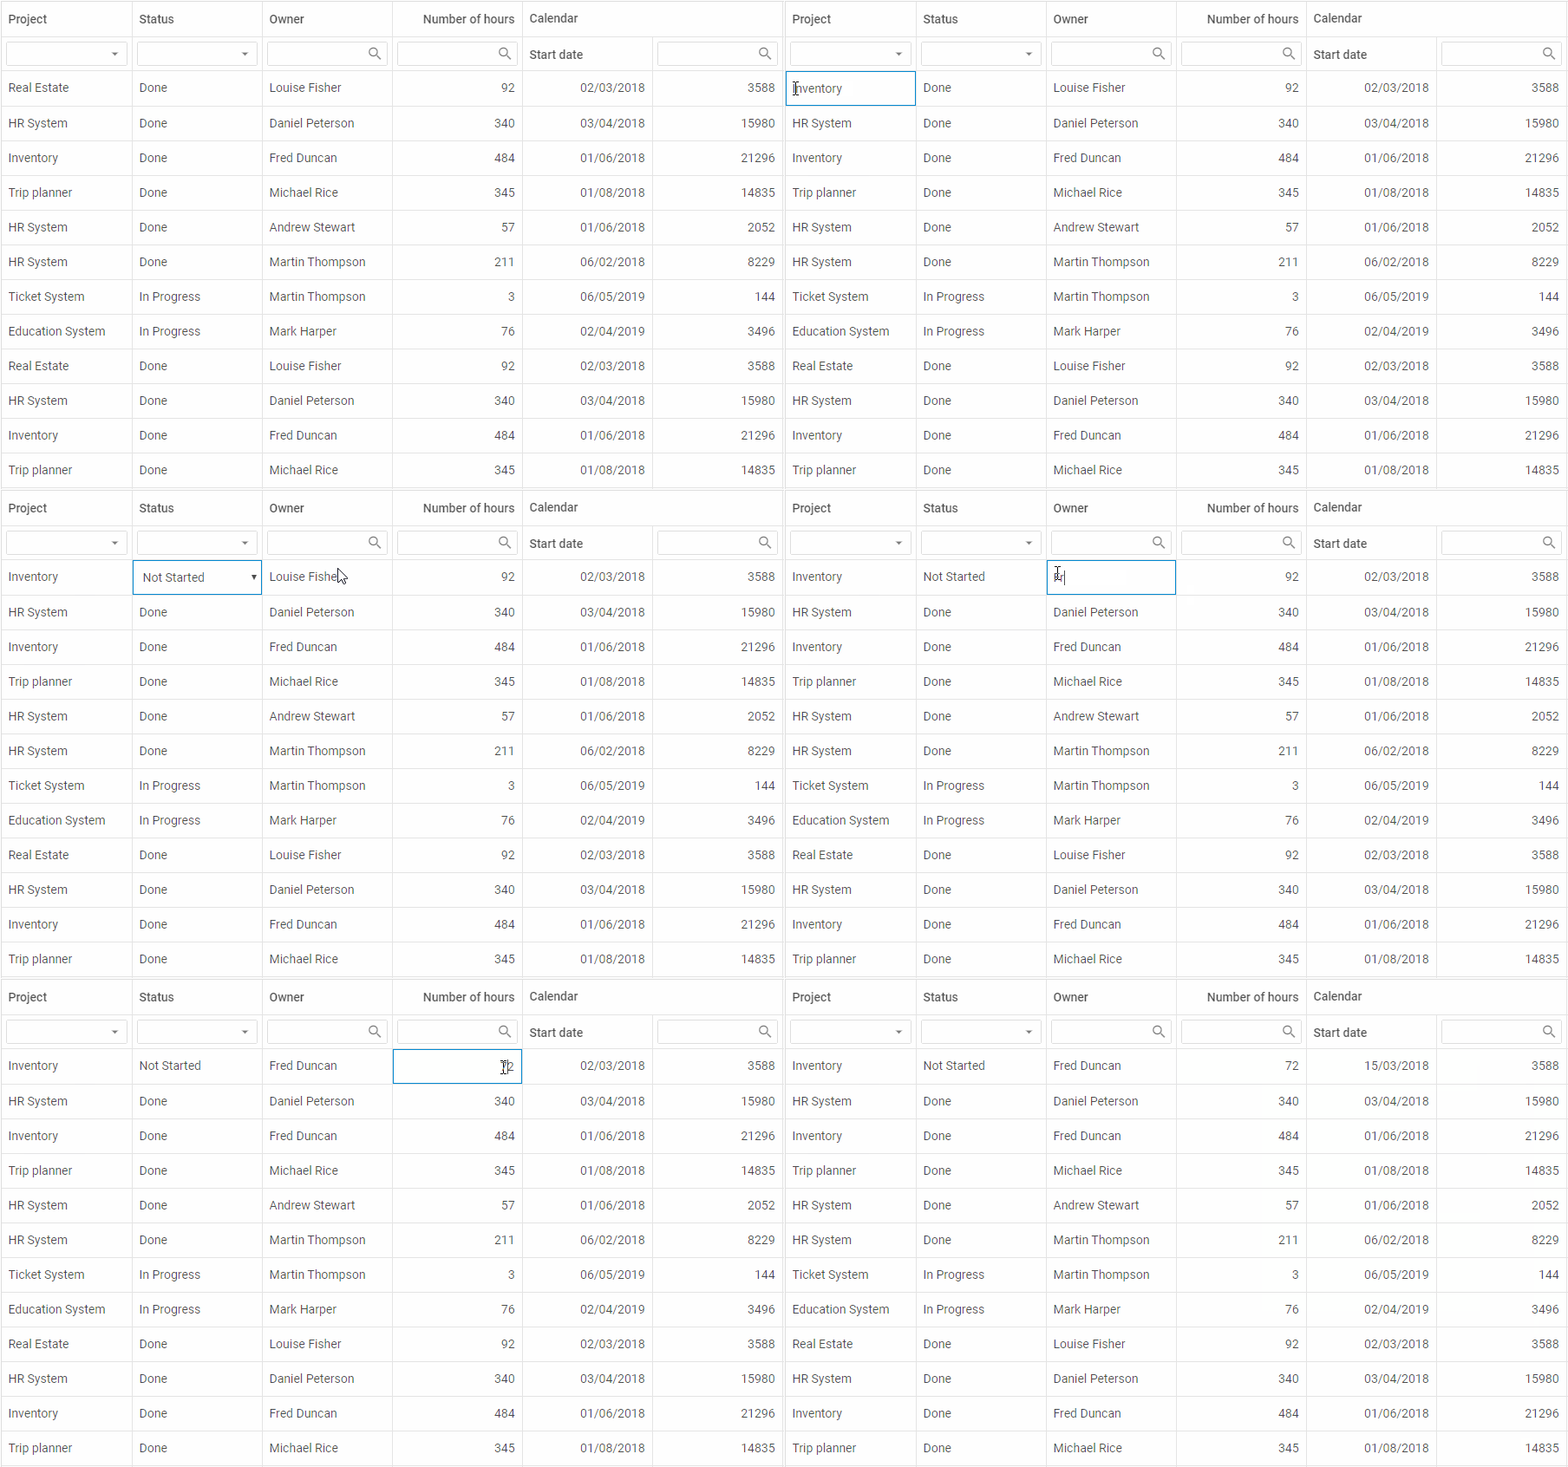
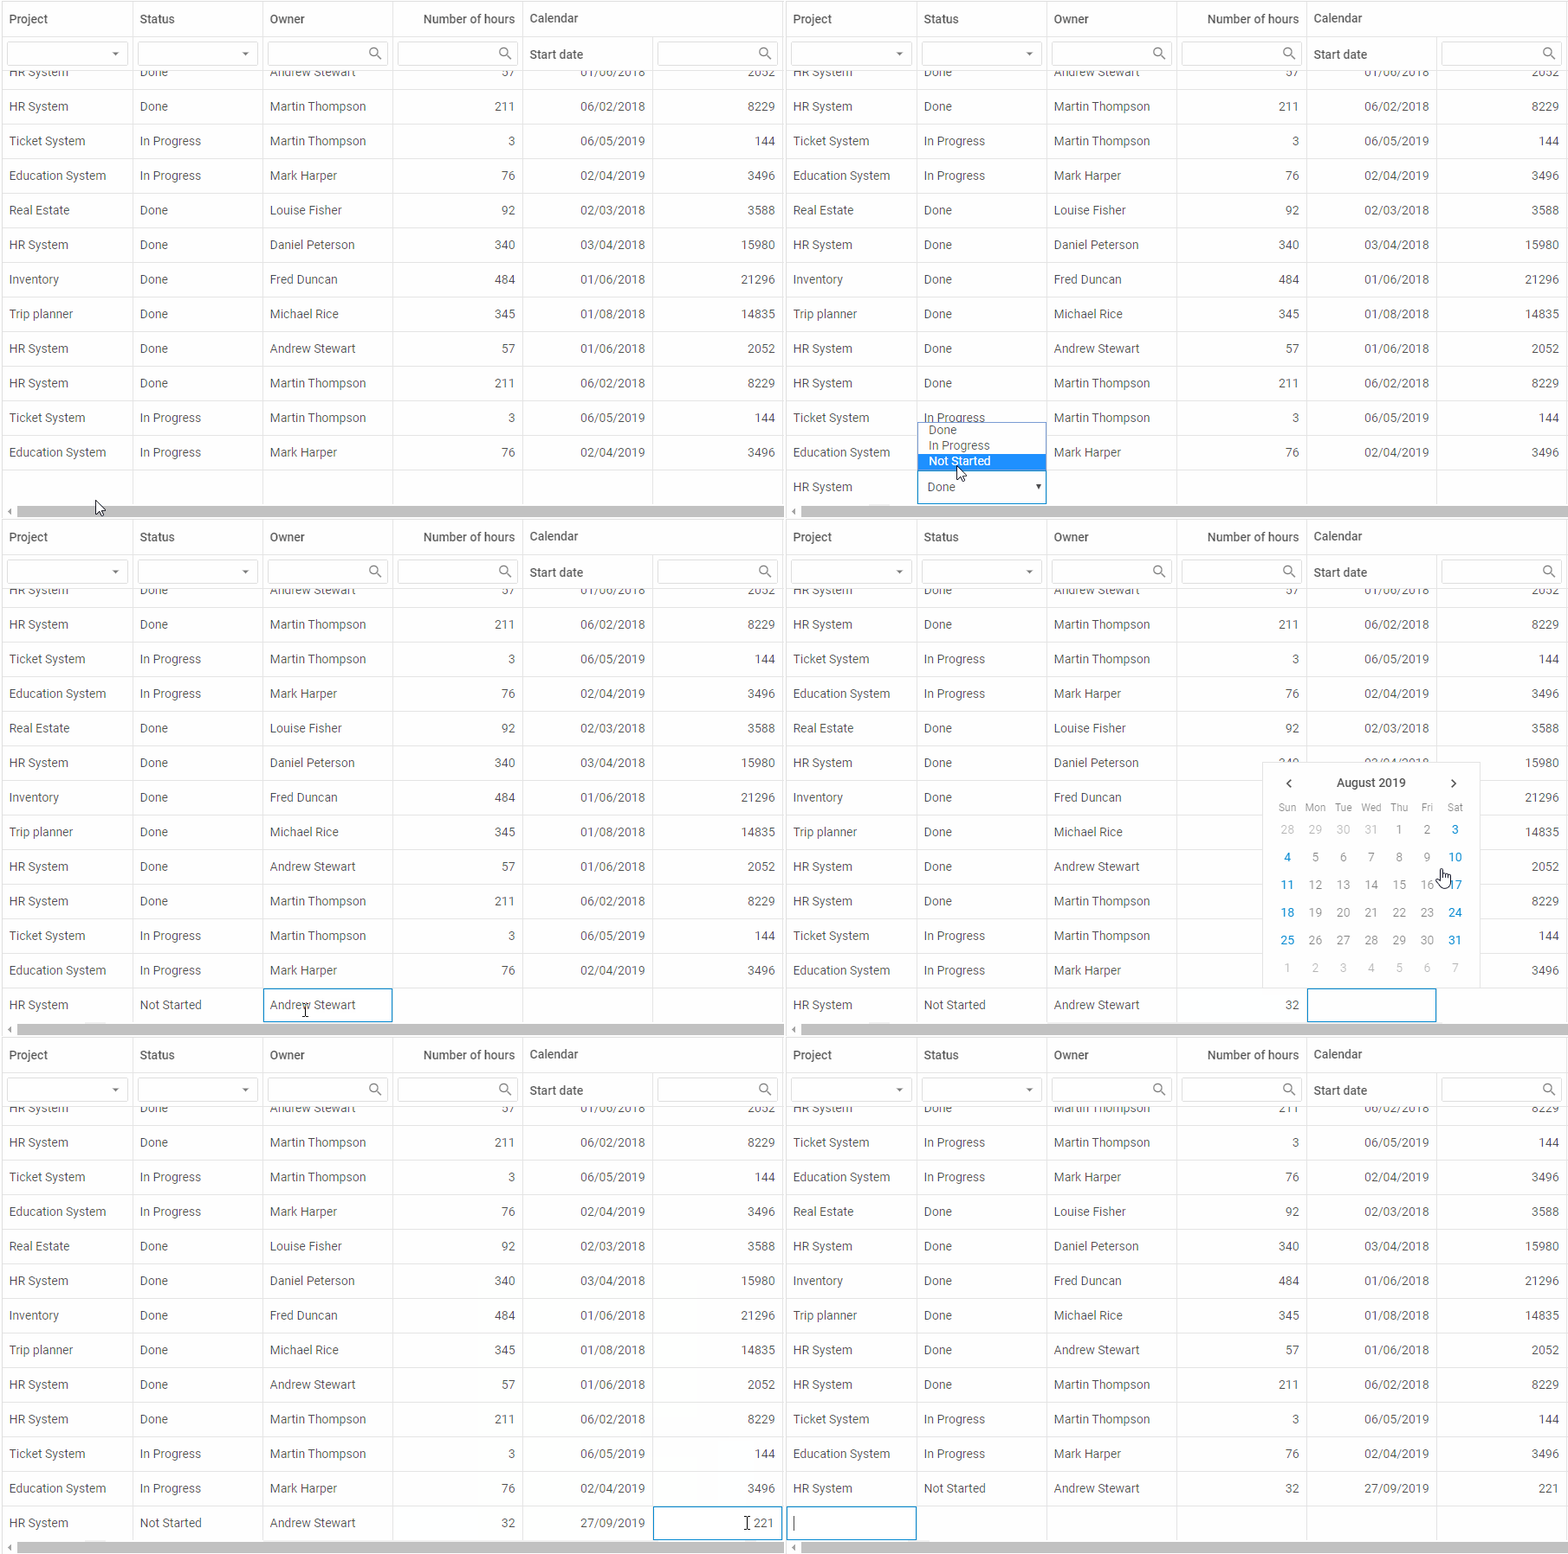
V6.1 provides new editing capabilities for our JavaScript Data Grid. Now end users can easily edit any cells they need on the fly. When they double click a cell, an appropriate editor appears: a simple input field, selection box or datepicker:
DHTMLX Grid editingCheck the sample >

As you can also see from the recording above, there appeared a new column type – date, which enables end users to choose a date on a calendar in the column “Start date”.

In order to achieve that and make an entire Grid editable, developers need to specify the editing:true property in the Grid configuration:

var grid = new dhx.Grid("grid_container", {
    columns: [// columns config],
    data: data,
   editing: true
});

However, you can limit a choice of columns that can be edited by end users if you set the editing:true property in the configuration of specific columns. For instance, here is how we can make only the first column editable:

var grid = new dhx.Grid("grid", {
    columns: [
        {
           width:150,id:"project",

          editing:true,
          header: [
            {text:"Project"}, {content:"selectFilter"}
           ]
        },
        { width:150, id:"owner", header: [{text:"Owner"},{content:"inputFilter"}]},
        { width:150, id: "hours", header: [{text:"Hours"}, {content:"inputFilter"}]},
        // more columns
    ],
    data: data
});

Check the documentation >

By default, columns have an input type of the editor for working with plain text. If a column has a type “date”, then a datepicker editor will be used. Developers can also set a specific date format for editing:

{
    // if the type:"date" config is set in the column config,
    // there's no need to specify the type of the editor
    width: 150, id: "start_date",
    header: [{ text: "Calendar", colspan: 2 }, { text: "Start date" }],
   type: "date", dateFormat: "%d/%m/%Y"
}

In order to equip a cell with a selection box with options to choose from, you’ll need to specify the select editor type and and add the desired options for selection:

{
    width: 150, id: "status", header: [{text: "Status"}, {content: "selectFilter"}],
   editorType: "select", options: ["Done", "In Progress", "Not Started"]
}

Check the documentation >

Additionally, now developers have a straightforward way to edit any Grid cell using the edit method. Here is how we can edit the first cell of the “project” column with just one line of code:

grid.edit(grid.data.getId(0),"project");

Check the documentation >

Vertical Spans in Header

Besides, now our Grid allows creating not only horizontal but also vertical spans in the header:
Vertical Header Spans in DHTMLX GridCheck the sample >

Empty Grid

On top of all, v6.1 makes it possible to initialize an empty Grid, without any data loaded into it. It also introduces the ability to automatically add an empty row into the end of the Grid when the last empty row is filled out with the help of the autoEmptyRow property:

var grid = new dhx.Grid("grid_container", {
    columns: [// columns config],
   autoEmptyRow:true,  
   data: dataset
});

Check the documentation >
Empty row at the end of DHTMLX GridCheck the sample >

Complex Selection

V6.1 delivers the ability to highlight a selected cell together with a row it belongs to. Check the documentation >

dhtmlxDataView and dhtmlxList New Features
Inline Editing

Besides dhtmlxGrid, our data processing components – DataView and List – also become easily editable starting from v6.1. There are two ways of setting up the editing functionality. The first one is via the API with the help of the edit method. It allows developers to define which item should be edited. For example, the following line of code instructs DataView to enable editing of the item with the id “1”:

dataview.edit("1");

However, there is a more convenient way, which gives end users an opportunity to edit all items at once. It can be enabled using the editing configuration option before the initialization of the component:

var dataview = new dhx.DataView("dataview_container", {editing:true});

Inline editing in DHTMLX DataViewCheck the sample >

The same edit method and editing configuration option can be applied in dhtmlxList. Read more in the documentation >

As for dhtmlxTree, previously developers were able to use the edit method for changing particular items. Now they can turn on inline editing of all Tree items with the help of the editing configuration property as well:

var tree = new dhx.Tree("tree", {editing: true});
Multiple Selection and Drag-n-Drop

V6.1 introduces a multiple selection of List and DataView items and multiple drag-n-drop.

By default, it’s possible to select just one item in a DataView or List at a time. However, with the multiselection configuration option developers can enable the selection of multiple items at once:

var dataview = new dhx.DataView("dataview", {multiselection:true});
var list = new dhx.List("list", {multiselection:true});

Multiselection has two modes of work. The default one makes use of “Ctrl + click” combination for selecting several items. But developers may switch on a simple click mode, which allows selecting multiple items by means of clicks only:

var dataview = new dhx.DataView("dataview", {
    multiselection:true,
    multiselectionMode:"click"  
});

Drag-n-drop of multiple items can be easily enabled by specifying the multiselection:true configuration property in addition to the dragMode. For example, let’s set up the drag-n-drop of multiple items in the DataView:

var dataview = new dhx.DataView("dataview_container", {
    dragMode:"source",
    multiselection:true
});

Drag-n-drop of multiple items in DHTMLX DataViewCheck the sample >

Other Updates

In addition to the main features presented above, we’ve updated a range of other UI components included in dhtmlxSuite: ComboBox, Form, Popup, Window – as well as Data and Tree Collection. For instance, dhtmlxCombo received the ability to hide and show a popup via the Popup API. dhtmlxWindow got a special method for checking the window’s visibility – isVisible. Learn about all the updates of JavaScript UI components in the documentation.

We invite you to try out dhtmlxSuite 6.1 during a 30-day evaluation period and benefit from the assistance of our technical support team.

Current clients are welcome to download the latest version in their Client’s Area.

We’ll be looking forward to your feedback! Stay tuned for future updates!

Related Materials:

The post dhtmlxSuite 6.1 Minor Update: Multiselection, Enhanced Drag-n-Drop and Editing Features appeared first on DHTMLX Blog.


dhtmlxPivot 1.4 Minor Update: Flat Mode, Export to CSV, and Dropdown Field Selectors

$
0
0

A long-awaited v1.4 of our JavaScript pivot table, a smart component for data analysis, is finally out!

The highlight of the release is the ability to display data in a flattened pivot table with repeated row labels. Besides, now dhtmlxPivot is able to export data not only to Excel but also to the CSV format, which is lightweight and simple to use with any programming language. We also supplied the component with a wide range of events firing on various user actions in the grid and updated the UX of field selectors.

So, let’s make a long story short…and invite you to download the latest v1.4 for 30-day evaluation!

Tree vs Flat Mode of the Grid

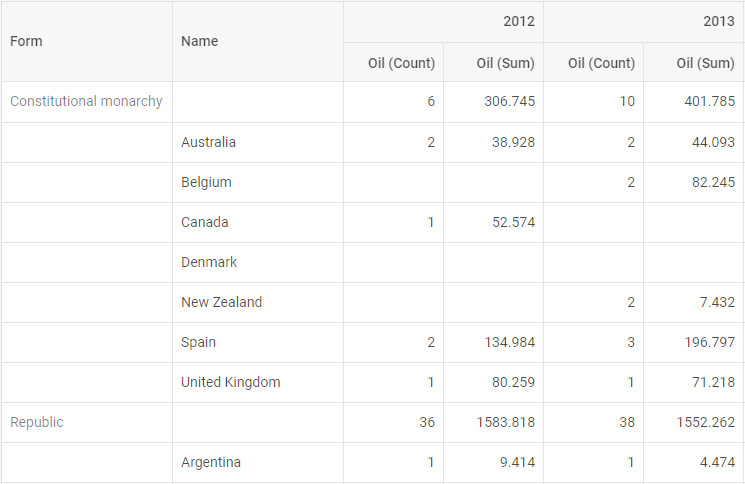
The update introduces different modes for visualizing pivot data. You can set up the desired mode according to the preferences of your end users. The tree-like structure of the grid has been used in dhtmlxPivot by default so far. V1.4 brings out the gridMode attribute of the layout object, which helps to redefine the mode of displaying data and present it as a flattened table as shown in the picture below:
Flat mode of the pivot gridCheck the sample >

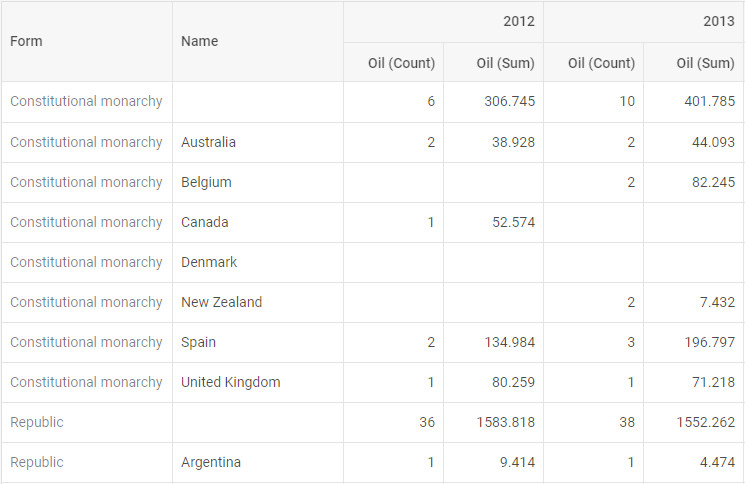
Apart from that, it’s possible to avoid duplicating row headers in the cells of the first column by specifying the repeatRowsHeaders:false property in the layout configuration:

var pivot = new dhx.Pivot(document.body, {
    data: dataset,
    fields: {
        rows: ["form", "name"],
        columns: ["year"],
        values: [{ id: "oil", method: "max" }, { id: "oil", method: "sum" }],
    },
    fieldList: [
        { id: "name", label: "name" },
        // the full list of fields
    ],

   layout: {                      
           gridMode:"flat",          
           repeatRowsHeaders: false    
   }                              
 }
);

Flat mode with repeated labelsCheck the sample >
The new flat mode is a convenient and easy-to-read way of visualizing pivot data. It may be familiar to end users due to a similar tabular form with repeated item labels of the Excel layout.

Export to CSV

The newly introduced pivot.export.csv() method of the Export module enables you to export pivot data to the CSV format. The export settings are quite flexible and allow for the necessary adjustments. By default, you’ll get a CSV file as a result of export. However, you can choose to export data only as a CSV string by specifying the asFile:false configuration property. Other settings permit converting pivot into a flat table and defining custom separators between rows and columns.

In the example below we’ll get a CSV file named “pivot_data” with a flat structure, tabs as row separators and semicolons as column separators:

pivot.export.csv({
    name:"pivot_data",
    asFile:true,
    flat:true,
    rowDelimiter: "\t",
    columnDelimiter: ";"
});

Check the sample >

Please note that since v1.4 we recommend using the pivot.export.xlsx() method of the Export module instead of the pivot.export() method. Read the migration article for more details.

New Dropdown Field Selectors

In v1.4 we added a new type of field selectors. Now with the help of the fieldSelectorType attribute you can define the look and feel of selectors and configure them either as loop selectors or dropdown lists:

var pivot = new dhx.Pivot(document.body, {
    data: dataset,
    fields: {
        // fields structure
    },
    fieldList: [
        // full list of fields
    ],
    layout: {
   fieldSelectorType:"dropdown"          
   }
  }
);

JS Pivot dropdown selectorsCheck the sample >

TreeGrid Events in the Pivot API

On top of all, starting with v1.4 dhtmlxPivot is able to listen to the grid events triggered by user actions such as clicks on cells, moving the mouse pointer, typing text in an input field, etc. The entire list of the newly added events is available in the documentation.

We hope the update will come in useful in your projects! We’re looking forward to hearing your feedback and comments. Feel free to evaluate the latest version with the help of our technical support team for free for 30 days.

We invite our current clients to download v1.4 of dhtmlxPivot in their Client’s Area.

Stay tuned!

Related Materials:

The post dhtmlxPivot 1.4 Minor Update: Flat Mode, Export to CSV, and Dropdown Field Selectors appeared first on DHTMLX Blog.

How to Make Hotel Booking Calendar with dhtmlxScheduler

$
0
0

dhtmlxScheduler is one of the most flexible components available, but yet when you check the basic examples of dhtmlxScheduler, they can look pretty far from a final result and feel that you need to implement. And a usual challenge for developers that are new to dhtmlxScheduler is how do I get from this:

timeline scheduler

to this:

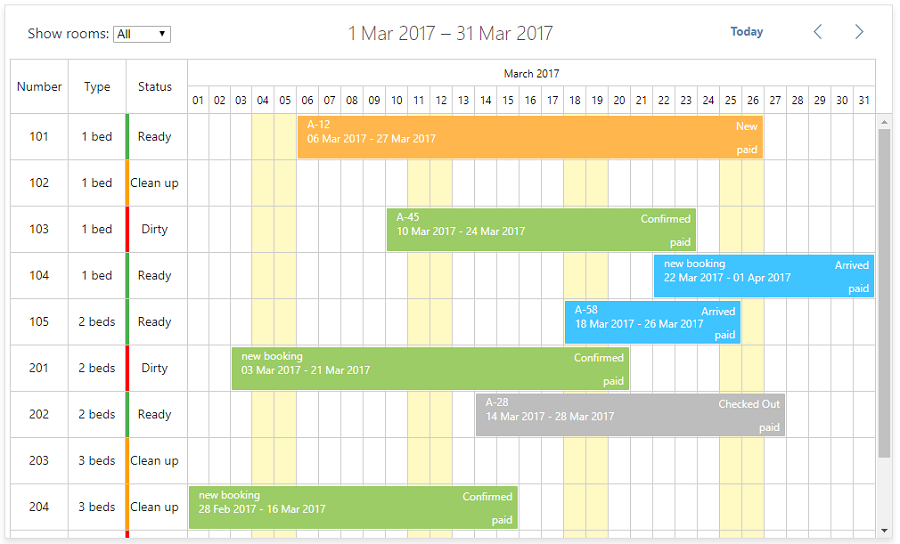
hotel calendar

At this point familiarizing with the API and figuring the appropriate approach can take an unnecessarily long time.

In this tutorial, we want to show you some frequently used settings in order to speed up this process. We’ll start from a plain timeline config and will show how to make it into something more complex, like our hotel reservation demo.

When you understand how our Scheduler component works, it’ll be much simpler for you to develop any functionality you want. As a result of this tutorial, you will learn how to work with the Scheduler’s timeline and be able to configure it based on your needs.

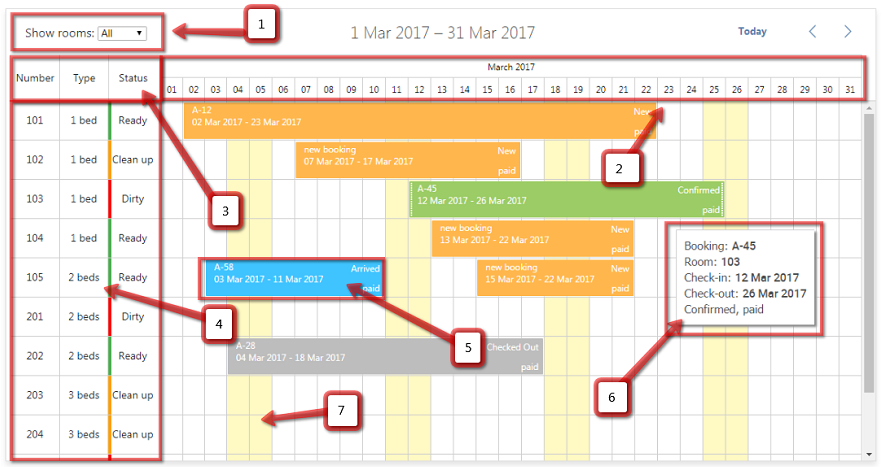
Now, let’s define which features we will implement during the tutorial:

features

  1. Filtering allows visualizing the rooms according to particular criteria
  2. Timescale should be changed to show a full month
  3. Lefthand labels, step one. We’ll add a header above the lefthand column
  4. Lefthand labels, step two. We’ll add the possibility to display multiple columns with a custom HTML content and colors
  5. The default appearance of the event boxes will be changed
  6. We’ll add custom tooltips
  7. We’ll add the highlight for the days off

As we successfully defined what should be done, we can proceed with the code writing.

Step 0 – Prerequisites

We’re starting with the plain timeline view, like the one you can find in our package:

Before proceeding with the coding, we’re doing some preparations.

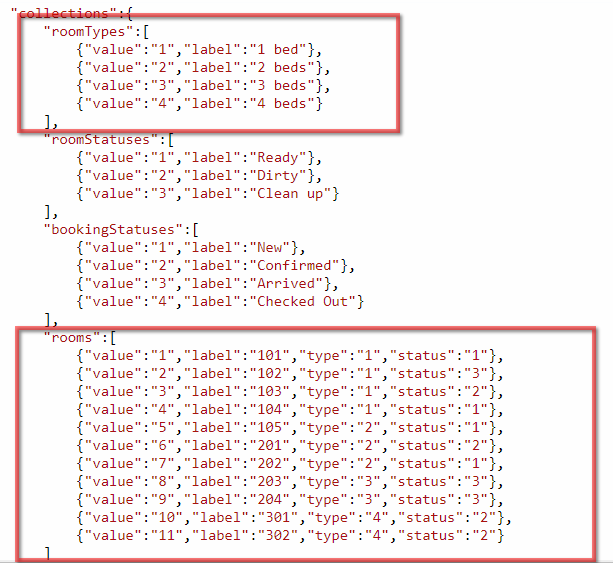
Firstly we add test data – we need lists of bookings, rooms, room types, booking statuses (confirmed, arrived, etc.) and room statuses (ready, clean up, dirty). In this tutorial we’ll load all of this in a single json document formatted like this.

All arrays from the “collections” part of json can be accessed using scheduler.serverList method by their respective name.

If the list objects have the expected structure (`key` and `value` properties), they can be connected to the timeline/units views or to the lightbox select controls directly. Moreover, if you reload data or update these collections from code, the views and controls connected to the appropriate collections will be repainted automatically in order to reflect the changes.

Thus, the data models may look as following:

booking:

{
   "id":"1",
   "start_date":"2017-03-02",
   "end_date":"2017-03-23",
   "text":"A-12",
   "room":"1",
   "status":"1",
   "is_paid":"1"
}

room:

{
   "value":"1",
   "label":"101",
   "type":"1",
   "status":"1"
}

booking status:

{
  "value":"3",
  "label":"Arrived"
}

room status:

{
  "value":"1",
  "label":"Ready"
}

room type:

{
  "value":"2",
  "label":"2 beds"
}

And here is how a complete JSON will look like. After we connect list of rooms to the timeline view, we’ll be able to see the following calendar and drag bookings between rooms:

Another small thing we can do is to set the default values, such as booking status, paid status or a default text. It is usually done via onEventCreated event:

scheduler.attachEvent('onEventCreated', function (event_id) {
    var ev = scheduler.getEvent(event_id);
    ev.status = 1;
    ev.is_paid = false;
    ev.text = 'new booking';
});

Check the code.

And now let’s go through the list of features we made.

Step 1 – Filtering timeline rows (rooms)

As we’ve found out at the previous step, we have a list of rooms which are displayed as rows of the timeline, and room types which are associated with the rooms:

values

What we want here is to filter timeline rows by the room type, e.g. ‘show two bed rooms only’.

How it’s usually done – scheduler allows dynamically replacing timeline rows with a new collection using
scheduler.serverList/updateCollection.

Knowing this, the task is pretty simple.

1) We connect the timeline to the empty serverList:

scheduler.createTimelineView({
    ...
    y_unit:    scheduler.serverList("visibleRooms"),
    ...
});

2) Then we define a function that filters a complete list of rooms, select ones that pass the filter and put them into “visibleRooms” list, updating the timeline:

window.showRooms = function showRooms(type) {
    var allRooms = scheduler.serverList("rooms");
    var visibleRooms ;
    if (type == 'all') {
        visibleRooms = allRooms.slice();
    }else{
        visibleRooms = allRooms
          .filter(function(room){
             return room.type == type;
        });
    }

  scheduler.updateCollection("visibleRooms", visibleRooms);
};

3) Once data is parsed, we can run the filters in order to populate the timeline initially:

scheduler.attachEvent("onParse", function(){
  showRooms("all");
});

When you will replace data loading from a client-side resource by scheduler.parse() method with data loading from a server-side resource by scheduler.load(), you must also replace onParse with onLoadEnd.
Here is how everything looks at this point.

Finally, let’s add a dropdown for a user to change the filter.
We can put it on the place of .dhx_cal_tab elements in the scheduler header:

<div id="scheduler_here" class="dhx_cal_container" style="width:100%; height:100%;">
    <div class="dhx_cal_navline">
        <div class="dhx_cal_prev_button">&nbsp;</div>
        <div class="dhx_cal_next_button">&nbsp;</div>
        <div class="dhx_cal_today_button"></div>
        <div class="dhx_cal_date"></div>
        <select id="room_filter" onchange='showRooms(this.value)'></select>
    </div>
    <div class="dhx_cal_header">
    </div>
    <div class="dhx_cal_data">
    </div>
</div>
scheduler.attachEvent("onParse", function(){
  showRooms("all");

  var roomSelect = document.querySelector("#room_filter");
  var types = scheduler.serverList("roomTypes");
  var typeElements = ["<option value='all'>All</option>"];
  types.forEach(function(type){
     typeElements.push("<option value='"+type.key+"'>" + type.label +"</option>");
  });
  roomSelect.innerHTML = typeElements.join("")
});

And that’s how we implement the filtering:

Step 2 – Displaying a full month in the time scale

As per requirements, we need a two line time scale – one day per cell of the time scale, and the month line on top of days. Also, the timeline should show a complete month.

The time unit and number of columns of the timeline view are defined by x_size/x_step/x_date properties of configuration object. It also allows adding a second row to the time scale.

So, intuitively we can get a config like this:

scheduler.createTimelineView({
    name:    "timeline",
    x_unit: "day",
    x_date: "%j",
    x_step: 1,
    x_size: 31,
    section_autoheight: false,
    y_unit:    scheduler.serverList("visibleRooms"),
    y_property:    "room",
    render:"bar",
    round_position:true,
    dy:60,
    second_scale:{
     x_unit: "month",
     x_date: "%F, %Y"
    }
});

And get a timeline looking like this:

You may see a problem here – the timeline must always start from the first day of the month, and a number of columns should match a number of days per month, which may vary.

How do we solve this? We can access the instance of the timeline view from code and modify the number of days per view according to the displayed month. We can do it each time the displayed date is changed using onBeforeViewChange event.

scheduler.attachEvent("onBeforeViewChange", function(old_mode,old_date,mode,date){
    var year = date.getFullYear();
    var month= (date.getMonth() + 1);
    var d = new Date(year, month, 0);
    var daysInMonth = d.getDate();
    var timeline = scheduler.getView('timeline');
    timeline.x_size = daysInMonth;

    return true;
});

Then we need to make sure that timeline starts from the first day of the month, this can be done using scheduler.date[timelineName + “_start”] method. This method is defined by the timeline instance and controls the starting point of the time scale:

scheduler.date.timeline_start = scheduler.date.month_start;

We use a ‘month_start’ method of scheduler date helper, which does exactly what we need.

Finally, we need to make sure that the timeline is scrolled for exactly one month when user clicks forward/backward navigation in the scheduler head. We do it by redefining scheduler.date.add_timeline method. This is also a generic scheduler.date[“add_” + viewName] method that is defined for the each view:

scheduler.date.add_timeline = function(date, step){
    if(step > 0){
        step = 1;
    }else if(step < 0){
        step = -1;
    }
    return scheduler.date.add(date, step, "month")
};

Note that the scheduler.date methods of the timeline should be declared after scheduler.createTimelineView call, otherwise the timeline will overwrite them.

And now you should have a correct month scale:

Step 3 – Adding a header to the lefthand column of the timeline

Now we need to add a header here:

header scheduler

There is timeline_scale_label template to set required markup into the header of Y-Axis in the Timeline view.
So, we’ll put HTML elements that we need to create 3 header’s columns into the variable and then will set this variable as the value of the template.

The code may look as following:

 var headerHTML = "<div class='timeline_item_separator'></div>" +
      "<div class='timeline_item_cell'>Number</div>" +
      "<div class='timeline_item_separator'></div>" +
      "<div class='timeline_item_cell'>Type</div>" +
      "<div class='timeline_item_separator'></div>" +
      "<div class='timeline_item_cell room_status'>Status</div>";
      scheduler.locale.labels.timeline_scale_header = headerHTML;

And css:

  .timeline_item_cell {
    width: 32%;
    font-size: 14px;
    text-align: center;
  }
  .timeline_item_separator {
    background-color: #CECECE;
    width: 1px;
    height: 100% !important;
  }
  .timeline_item_separator,
  .timeline_item_cell {
    vertical-align:top;
    height: 100%;
    display:inline-block;
    line-height: 60px;
    vertical-align:top;
  }

Step 4 – Adding multiple columns to the left part of the timeline

Scheduler always creates a single column before the time scale of the timeline, and as of the current version, there is no way to tell it otherwise.

The good news are, we have a complete control over the contents of that column via template function. Thus, we can put any html into that column, including extra cells.

In short, the code may look like following:

scheduler.attachEvent("onTemplatesReady", function(){
 
     function findInArray(array, key) {
        for (var i = 0; i < array.length; i++) {
            if (key == array[i].key)
                return array[i];
        }
        return null;
    }

    function getRoomType(key) {
        return findInArray(scheduler.serverList("roomTypes"), key).label;
    }

    function getRoomStatus(key) {
        return findInArray(scheduler.serverList("roomStatuses"), key);
    }

    function getRoom(key) {
        return findInArray(scheduler.serverList("rooms"), key);
    }

    scheduler.templates.timeline_scale_label = function (key, label, section) {
        var roomStatus = getRoomStatus(section.status);
        return ["<div class='timeline_item_separator'></div>",
            "<div class='timeline_item_cell'>" + label + "</div>",
            "<div class='timeline_item_separator'></div>",
            "<div class='timeline_item_cell'>" + getRoomType(section.type) + "</div>",
            "<div class='timeline_item_separator'></div>",
            "<div class='timeline_item_cell room_status'>",
            "<span class='room_status_indicator room_status_indicator_"+section.status+"'></span>",
            "<span class='status-label'>" + roomStatus.label + "</span>",
            "</div>"].join("");
    };
 
});

And css:

.collection_label {
  z-index: 2;
}

.room_status {
    position: relative;
}


.room_status_indicator {
    position: absolute;
    background-color: red;
    left: 0;
    top: 0;
    right: 95%;
    bottom: 0;
}

.room_status_indicator_1 {
    background-color: #4CAF50;
}

.room_status_indicator_2 {
    background-color: red;
}

.room_status_indicator_3 {
    background-color: #FFA000;
}

Step 5 – Changing the color and the inner contents of the event boxes

There are three settings that define the look of an event in the timeline view:

1) the height of the event box is defined by event_dy property of the Timeline config.

2) css class applied to the event box

3) and the inner html of the event box

We’ll need all of them.

Firstly, let’s make events occupy the whole height of the timeline row:

scheduler.createTimelineView({
...
  event_dy: "full",
...
});

Now let’s color events based on their status.

For that we’ll need css rules for each status, for this tutorial we’ll simply hardcode them:

.event_1 {
    background-color: #FFB74D !important;
}

.event_2 {
    background-color: #9CCC65 !important;
}

.event_3 {
    background-color: #40C4FF !important;
}

.event_4 {
    background-color: #BDBDBD !important;
}

And assign these classes to the appropriate events:

scheduler.templates.event_class = function (start, end, event) {
    return "event_" + (event.status || "");
};

And the coloring should be done:

The template is called each time the event is repainted. So, if a user changes event status from the UI, a new color will be immediately applied.

And now we move to the inner content of events. As you remember, our aim is something like this:

labels

Here is how it can be implemented:

function getBookingStatus(key) {
    var bookingStatus = findInArray(scheduler.serverList("bookingStatuses"), key);
    return !bookingStatus ? '' : bookingStatus.label;
}

function getPaidStatus(isPaid) {
    return isPaid ? "paid" : "not paid";
}

var eventDateFormat = scheduler.date.date_to_str("%d %M %Y");
scheduler.templates.event_bar_text = function (start, end, event) {
    var paidStatus = getPaidStatus(event.is_paid);
    var startDate = eventDateFormat(event.start_date);
    var endDate = eventDateFormat(event.end_date);
    return [event.text + "<br />",
        startDate + " - " + endDate,
        "<div class='booking_status booking-option'>" + getBookingStatus(event.status) + "</div>",
        "<div class='booking_paid booking-option'>" + paidStatus + "</div>"].join("");
};

And css:

.booking_status, .booking_paid {
    position: absolute;
    right: 5px;
}

.booking_status {
    top: 2px;
}

.booking_paid {
    bottom: 2px;
}

.dhx_cal_event_line:hover .booking-option {
    background: none !important;
}

Step 6 – Tooltips

Tooltips are defined in the extension file which has to be added to the page after dhtmlxscheduler.js.

<script src="./scheduler/ext/dhtmlxscheduler_tooltip.js"></script>

After that we can define a tooltip content using tooltip_text template.

scheduler.templates.tooltip_text = function (start, end, event) {
     var room = getRoom(event.room) || {label: ""};

     var html = [];
     html.push("Booking: <b>" + event.text + "</b>");
     html.push("Room: <b>" + room.label + "</b>");
     html.push("Check-in: <b>" + eventDateFormat(start) + "</b>");
     html.push("Check-out: <b>" + eventDateFormat(end) + "</b>");
     html.push(getBookingStatus(event.status) + ", " + getPaidStatus(event.is_paid));
     return html.join("<br>")
};

Note that we reused helper functions we’ve declared for event text and header templates, all these templates are supposed to be declared in the same scope.

And here is how the result looks like:

There are a couple of things to consider regarding tooltips.

Tooltip template can be called very frequently. It’s preferable not to make the tooltip_text function too heavy. If the tooltip should show a result of some relatively complex calculations, it’s better to precalculate values and save them into some property of the event object, rather than calculating them each time from the tooltip template.

Find out the related docs here and here.

The template function does not support async/promise result and you can’t use synchronous requests there (technically one could, but that would hit client-side performance and usability hard).

Thus, if you need to load tooltip content from the backend, simply requesting the data from a tooltip wouldn’t be enough.

This is usually solved by loading the tooltip content into some property of an event via ajax and returning this property value from the tooltip template. If the property value is not loaded from the server yet, you can display some kind of placeholder. Here is a jsfiddle where we emulate ajax loading with timeouts, but the idea is the same.

Step 7 – Highlight weekends

It’s also done with the help of the extension which allows coloring time ranges from code.

One important thing – if you use the dhtmlxsheduler_limit.js extension together with the timeline, it should be added before the dhtmlxscheduler_timeline.js:

<script src="./scheduler/dhtmlxscheduler.js"></script>
<script src="./scheduler/ext/dhtmlxscheduler_limit.js"></script>
<script src="./scheduler/ext/dhtmlxscheduler_timeline.js"></script>

After you add the extension you can color days like this:

scheduler.addMarkedTimespan({
  days: [0, 6],
  zones: "fullday",
  css: "timeline_weekend"
});

CSS:

.timeline_weekend {
    background-color: #FFF9C4;
}

Here is the result:

A more complex use-case would involve loading areas you want to highlight from the backend.

Usually it’s done from onBeforeViewChange event. You can detect when the displayed date is changed and start loading markers for the displayed range.

Once they loaded – you can add them using scheduler.addMarkedTimespan and repaint scheduler to display them:

Step 8 – Configuring the lightbox

What we need from the details form:

For this we’ll need to add extensions where these controls are defined:

<script src="./scheduler/dhtmlxscheduler.js"></script>
<script src="./scheduler/ext/dhtmlxscheduler_minical.js"></script>
<script src="./scheduler/ext/dhtmlxscheduler_editors.js"></script>

And update the settings of the lightbox:

scheduler.config.lightbox.sections=[
  {map_to: "text", name: "text", type: "textarea", height: 24},
  {map_to: "room", name: "room", type: "select", options: scheduler.serverList("visibleRooms")},
  {map_to: "status", name: "status", type: "radio", options: scheduler.serverList("bookingStatuses")},
  {map_to: "is_paid", name: "is_paid", type: "checkbox", checked_value: true, unchecked_value: false},
  {map_to: "time", name: "time", type: "calendar_time"}
];

Note that no lightbox controls have a config for the default value – that’s intentional. Lightbox controls are configured to read the value from specific properties of the event object.

That means that instead of setting a default value for the lightbox control, you should set default property values of the scheduler event object itself. It’s done like we did in the step 0, the lightbox will reflect them once opened.

Also, add a following config for labels of lightbox controls:

scheduler.locale.labels.section_text = 'Name';
scheduler.locale.labels.section_room = 'Room';
scheduler.locale.labels.section_status = 'Status';
scheduler.locale.labels.section_is_paid = 'Paid';
scheduler.locale.labels.section_time = 'Time';

After that you’ll get the lightbox looking like this:

As you can notice, the description at the top-left container of the lightbox is now not quite useful for us:

time lightbox

We can redefine this content. Check the docs.

scheduler.templates.lightbox_header = function (start, end, ev) {
    var formatFunc = scheduler.date.date_to_str('%d.%m.%Y');
    return formatFunc(start) + " - " + formatFunc(end);
};

Step 9 – Preventing double bookings for the same time

To avoid double bookings, we’ll use this extension.

<script src="./scheduler/ext/dhtmlxscheduler_collision.js"></script>

Once you add it to the page, it will revert actions that put several events to the same time.
You can also control this behavior by capturing the onEventCollision event either to conditinally allow double bookings, or simply show a user some warning

scheduler.attachEvent("onEventCollision", function (ev, evs) {
  for (var i = 0; i < evs.length; i++) {
    if (ev.room != evs[i].room) continue;
    dhtmlx.message({
      type: "error",
      text: "This room is already booked for this date."
    });
  }
  return true;
});

Conclusions

Overcoming the learning curve of dhtmlxScheduler, you’ll see that it’s possible to build on new features and change the look and behavior of the component pretty simply. We hope that this tutorial gave you a clear understanding how the Timeline of dhtmlxScheduler behaves and helped you in achieving your own goals when building your applications.

If you’re already familiar with our tutorials, you may notice that this time we used jsfiddle to provide you with a more detailed and informative description of each step. Do you find it useful?

Also, if you have any thoughts and ideas what the next topics/tutorials you would like to discover, don’t hesitate to share them in comments. We are open for suggestions.

Originally published on Dec 21, 2017, 14:00

The post How to Make Hotel Booking Calendar with dhtmlxScheduler appeared first on DHTMLX Blog.
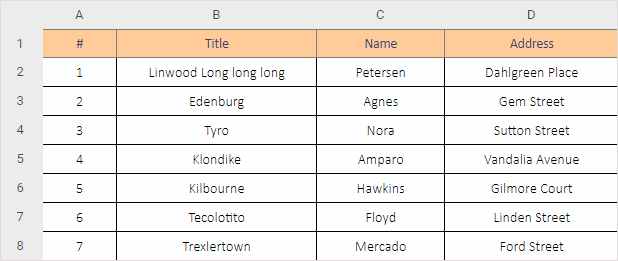
JavaScript Bar Chart: Exploring Data Visualization Techniques

$
0
0

DHTMLX Chart, a part of the modern Suite UI library, consists of different types of graphs. One of the most widely used is a javascript bar chart, which allows comparing data categories and seeing their changes over time. Try out dhtmlxChart by downloading a 30-day free trial.

Where to Use JavaScript Bar Charts?

A bar graph is a visual tool that allows comparing data among categories. The chart displays categorical data as rectangular bars with heights equivalent to the values that they represent. Usually, the categories appear along the horizontal axis, and a vertical one represents a measured value of the categories being compared.

HTML Bar Chart by DHTMLX

Simply put, bar charts are a must-have in the data visualization arsenal. They are quick to create, show comparison clearly, and are easy for the audience to understand.

A bar chart in JavaScript has the following fields of use:

  • Providing an intuitive view to the values of each category.
  • Comparing sets of data between different groups at a glance. Thus, for example, users can analyze data by a quarter or annually and see how results are distributed throughout each year.
  • Tracking big changes in data over time (for example, months or years).
What Are the Ways to Visualize Data With a Bar Graph?

If you have to show the frequency and ratio of each category, a single bar chart would be the best solution. Thus you will see the values of items clearly with the length of each bar.

Simple bar chart by DHTMLX

Moreover, a simple JavaScript bar chart allows arranging bars in any order. Bar graphs organized from highest to lowest incidence are called Pareto charts. In this way, the graph visually depicts which situations are more significant.

A single HTML bar chart is intuitive to view the values. However, there is one noticeable limitation: as soon as you have more than about 10 categories being displayed next to each other, labels can become hard to read. Indeed Y-bar graphs don’t leave much space for the text below.

A horizontal bar chart in HTML/JavaScript solves this issue. X-Bar graphs allow for much longer label text because the labels are above each other and not beside.
JS horizontal bar chartCheck the sample >

Some bar graphs present columns sorted in groups, showing the values of more than one measured variable. These are clustered bar charts used to compare multiple series inside the same category.

In clustered bar charts, each categorical group consists of two or more bars. Let us suppose that a business owner decided to compare the revenue of his 3 companies. Thus he can build a grouped graph.

Below you can see a clustered HTML bar chart example with different colored bars to represent each company. The horizontal axis shows the months of the year and the vertical one illustrates the profit.

Сlustered bar chart by DHTMLXCheck the sample >

As a clustered bar chart makes it complex to show the differences between the totals of each group, JavaScript stacked bar graph comes in to fix it. It is composed of multiple bar series placed vertically one after the other. If there are any negative values, they are stacked in reverse order below the chart’s axis baseline.

HTML stacked bar chart is a good choice if you have to:

  • Demonstrate the total size of the groups.
  • Track the variation in the individual values along with their total value.
  • Visualize data that is naturally divided into components, like sales by district, time span or product type.

Stacked bar chart by DHTMLXCheck the sample >

With a vertical diverging bar chart in JavaScript, end-users can view the spread of negative and positive values. The key point is comparing data with a middle point and categorizing chart bars above and below a common baseline.
Base line in JS bar chart by DHTMLXCheck the sample >

Why Build JavaScript Bar Chart with DHTMLX?

Building a bar chart using JavaScript is simple and convenient with our dhtmlxChart component, which also provides 10 other types of graphs: X-Bar, Line and Spline, Area and Spline Area, Pie and Donut (that have 2D and 3D variations), Radar and Scatter charts.

Material Styling

Back in 2014, Google announced guidelines designed to support a common look and feel across applications that run on Google platforms. This effort, called Material Design, uses more grid-based layouts, improved color palette, clearer label formatting, and depth effects such as lighting and shadows.

We at DHTMLX respect common practices and have designed our Chart component in Material style.

Suitable Configuration

Our bar chart is highly flexible. Users can easily modify scales, series, and legend and even toggle off a series in a legend by using our API.

Here you can see how to create a bar chart in HTML using JavaScript and configure series:

var chart = new dhx.Chart("chart_container",{
    type:"bar",
    scales: {
        "bottom" : {
            text: "month"
        },
        "left" : {}
    },
    series: [
        {
            id: "A",
            value: "company A",
            fill: "#394E79",
            stacked: stacked,
            color: "none"
        },
        {
            id: "B",
            value:"company B",
            fill: "#5E83BA",
            stacked: stacked,
            color: "none"
        }
    ]
});

You are also able to choose the proper type of scales and tailor it depending on your needs:

var chart = new dhx.Chart("chart_container",{
    type:"area",
    scales: {
        "bottom" : {
            text: 'month'
        },
        "left" : {
            padding: 10,
            max: 90
        }
    },
    series: [
        {
           value: 'company A',
           strokeWidth: 2
           // more options  
        }
    ]
});

The configuration of a chart legend includes a number of options, for instance, enabling you to add a legend and define its position:

var chart = new dhx.Chart("chart_container",{
    scales: {
        // scales config
    },
    series: [
        // list of series
    ],
    legend: {
        series: ["A", "B", "C"],
        valign: "top",
        halign: "right"
    }    
});
Flexible Customization

Style manipulations are achieved via CSS. dhtmlxChart component lets you control several aspects of bar appearance, tailor paddings, margins, and sizes of all graph’s elements. Our users can specify colors and transparency, apply a color gradient to bars as you can see in the screenshot below.

Js bar chart with gradient by DHTMLXCheck the sample >

However, despite the endless opportunities for customizing our JavaScript bar chart library, we highly recommend to choose a proper style and focus on it. Do not mix various styles too freely inside the single chart.

DHTMLX Chart is a part of the Suite UI library. Thus, you can test and order dhtmlxChart as a separate component or choose a complete Suite library with 20+ full-featured widgets. Our cutting-edge JavaScript library allows building modern and rich web interfaces, makes them compatible with all modern browsers and provides integrations with React, Vue.js, and Angular.

Conclusion

Data visualization gets easier and more exciting when you understand what tools and under what conditions are the best. A simple bar chart, for example, allows comparing values in a single data series. Users are able to analyze data sets between different groups and capture data changes over time.

DHTMLX fully-featured JavaScript chart library offers different graph types to illustrate whatever you need and build a rich user experience. Get deeper insight into the features of our charts by accessing our documentation.

You can download a 30-day trial version for free in case you decided to try dhtmlxChart library possibilities.

Do not hesitate to contact us if you have any issues or leave your comments below.

The post JavaScript Bar Chart: Exploring Data Visualization Techniques appeared first on DHTMLX Blog.

How to Manage Columns Visibility in the Grid of dhtmlxGantt – Video Tutorial

$
0
0

Let’s keep on learning all the valuable possibilities of our JavaScript Gantt library with the help of our video tutorials.


In the fourth video from our series, we’ll dive into managing the columns visibility in the grid of dhtmlxGantt. The challenge you can face is that users may want to show all the possible info in the grid, to the point that the grid may take up all the available space:
JS Gantt ColumnsThere are two possible solutions for that. We can either add a horizontal scrollbar into the grid and make it thinner, or allow a user to select which columns are going to be visible.

Horizontal Scroll

Let’s start with the first approach. We can make our grid scrollable using the scrollable property of the layout configuration option:

gantt.config.layout = {
    css: "gantt_container",
    cols: [
        {
        width:400,
        min_width: 300,
        rows:[
            {view: "grid", scrollX: "gridScroll", scrollable: true, scrollY: "scrollVer"},
            {view: "scrollbar", id: "gridScroll", group:"horizontal"}
        ]
        },
        {resizer: true, width: 1},
        {
        rows:[
            {view: "timeline", scrollX: "scrollHor", scrollY: "scrollVer"},
            {view: "scrollbar", id: "scrollHor", group:"horizontal"}
        ]
        },
        {view: "scrollbar", id: "scrollVer"}
    ]
};

Check the source code >

We split the Gantt layout into several columns:

  • The grid
  • The timeline
  • The resizer element between the grid and the timeline
  • And the vertical scrollbar

In order to add an inner scrollbar into the grid element, add the scrollable property to the grid object and connect it to the horizontal scrollbar located in the same column. After that we can scroll the grid using the scrollbar element.

We also need a horizontal scrollbar for the timeline element, which is added in the same way.

Lastly, we connect both the grid and the timeline to the same vertical scrollbar element in order to synchronize their vertical position.
Horizontal Scrollbar in GanttCheck the documentation >

Hiding Columns in the Grid

Another approach to our original challenge is to provide a user with an ability to select which columns should be visible:
Visible columns of the Grid in Gantt
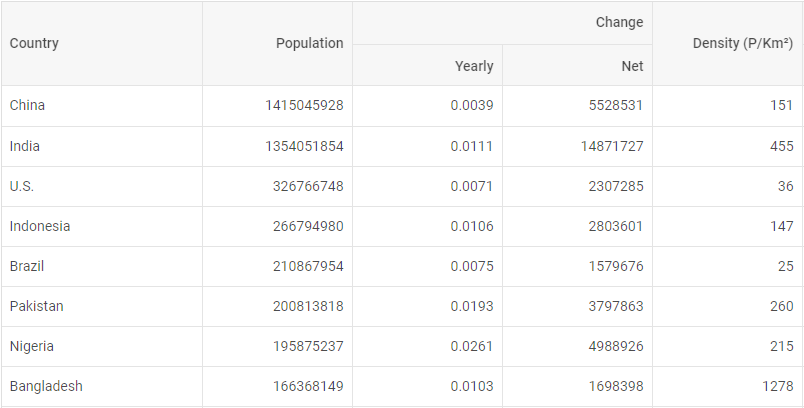
To do so, add a UI element where a user will be able to specify the visible columns and change the configuration of the grid after the user’s selection. You can hide any column either by removing it from the columns config or by setting the hide:true property.

Given that we already know how to add a UI control where a user can select columns as well as add a dropdown menu to the Gantt header – all we need is to add inputs for each defined column. When the selection changes, we prepare an array of selected columns:

function createColumnsConfig(selectedColumns){
    var newColumns = [];

    allColumns.forEach(function(column){
        if(selectedColumns[column.name]){
            newColumns.push(column);
        }
    });

    newColumns.push(controlsColumn);
    return newColumns;
}

Assign it to the columns config and repaint the Gantt:

dropDown.onchange = function(){
    var selection = getColumnsSelection(dropDown);
    gantt.config.columns = createColumnsConfig(selection);
    gantt.render();
}

Check the source code >

Ready to try it out on your own Gantt? Download our free 30-day trial version and get down to experimenting with the visibility of columns in the grid of dhtmlxGantt.

We also invite you to subscribe to our YouTube channel and keep an eye on the latest video tutorials!

Related Materials:

The post How to Manage Columns Visibility in the Grid of dhtmlxGantt – Video Tutorial appeared first on DHTMLX Blog.
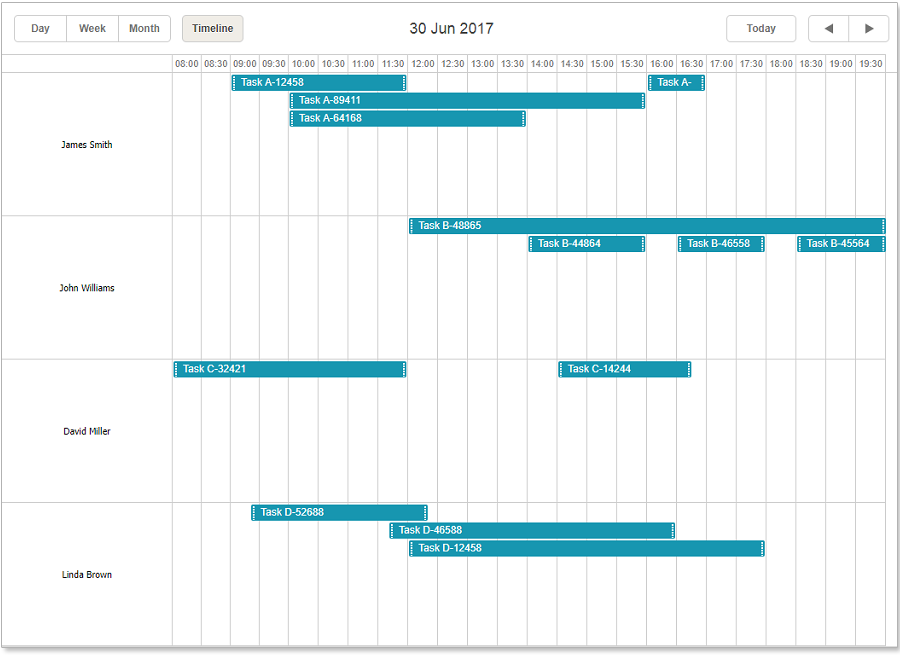
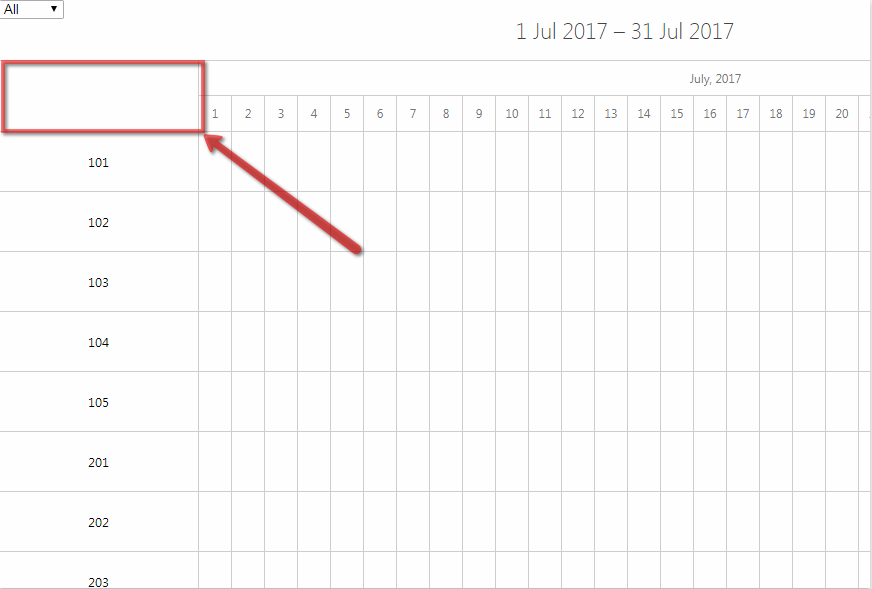
dhtmlxScheduler 5.3 Minor Update: RTL Support and Improved Responsiveness

$
0
0

Good news for the users of RTL languages and mobile device addicts! A brand new v5.3 of our JavaScript event calendar comes out with the support for right-to-left locales and greatly enhanced UI/UX for mobile screens. Besides, in v.5.3 we’ve polished Scheduler’s compatibility with our state-of-the-art Suite UI library.
Download dhtmlx Scheduler - JavaScript event calendar

Feel free to download and evaluate Scheduler’s update 5.3 and share your feedback with us!

RTL Mode

RTL mode is a highly-demanded feature of many users in the Eastern world. In v5.3 our dev team equipped dhtmlxScheduler with a new configuration option ensuring RTL support:

scheduler.config.rtl = true;

By default, the rtl property is set to false. In order to switch on the RTL mode, developers should specify the rtl=true configuration option before the component’s initialization. It will make dhtmlxScheduler automatically display all the events from right to left as shown in the picture below:

RTL mode of DHTMLX SchedulerCheck the sample >
After that, you may also reorder the elements of the header via CSS if needed.

The RTL mode changes the appearance of all Scheduler views as well as the lightbox:
DHTMLX Scheduler RTL viewsCheck the sample >

Meanwhile, dhtmlxScheduler can be easily customized in the RTL mode according to your requirements. We prepared a list of additional CSS classes, to which you may apply any styles you need and thus fine-tune the look and feel of your event calendar:

  • dhx_cal_container_rtl – sets styles for the container
  • dhx_tooltip_rtl – sets styles for tooltips
  • dhx_quick_info_rtl – sets styles for the ‘quick info’ popup
  • dhx_cal_light_rtl – sets styles for the lightbox
Improved Responsiveness

Another challenge that our users face is making Scheduler responsive on small screens. Starting with v5.3, things should become much easier for developers. We tried to address two main issues that were receiving quite a lot of complaints regarding mobile support – the navigation (or header) panel on top of Scheduler and the lightbox.

Now you can easily define headers that would look good on mobile screens using the header configuration property. The lightbox has a mobile friendly mode, which can be enabled via the responsive_lightbox configuration option.

That’s how dhtmlxScheduler looks like on mobile devices now:
DHTMLX Mobile SchedulerCheck the sample >

While a responsive lightbox is disabled by default, you can enable it via the responsive_lightbox configuration option:

scheduler.config.responsive_lightbox = true;

We also introduced a new CSS class dhx_cal_light_responsive for the responsive lightbox, which allows you to customize it to meet your needs.

Integration with dhtmlxSuite 6

On top of all, the latest v5.3 of our event calendar implements smooth integration with DHTMLX UI components library – dhtmlxSuite 6. Read more in the documentation >

We are eager to invite our users to evaluate a brand new v5.3 during a 30-day trial period. Our clients are welcome to get the latest update in their Client’s Area.

We’re looking forward to your feedback!

Related Materials:

The post dhtmlxScheduler 5.3 Minor Update: RTL Support and Improved Responsiveness appeared first on DHTMLX Blog.

Viewing all 228 articles
Browse latest View live