If it is necessary to visually present data over a specific time span, a JavaScript timeline chart (or diagram) is exactly what you need. This type of chart serves as an effective way to show various processes that are arranged in chronological sequence.
This data visualization tool has a wide range of applications. It is commonly used for educational purposes, in historical studies, and natural sciences. With the rapid development of computer technologies, timeline charts have also gained great popularity in the business area.
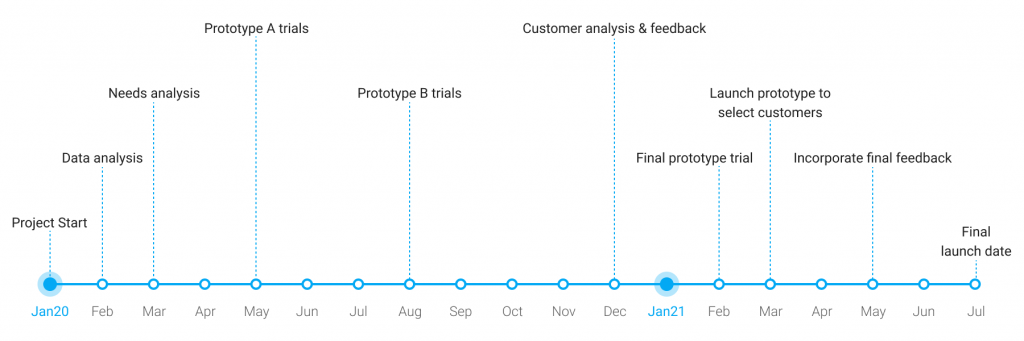
![JavaScript timeline]() That’s how a standard timeline chart looks like
That’s how a standard timeline chart looks like
It is hard to imagine a modern B2B or enterprise application without a timeline functionality. In this article, we will consider possible usage scenarios of JavaScript timeline controls in project management and find out how these data visualization components are employed in DHTMLX libraries.
JavaScript Timeline Charts in Project Management Apps
Using timelines has become a key pillar for business-oriented apps, as any project usually consists of time-related tasks and events. The holistic view of project activities gives a clear insight into the past and current situation on the project and allows making plans for the future.
That is why business people, and project managers in particular, often rely on timeline functionality for road mapping or portfolio management, but more frequently utilize it in planning tools such as project calendars and Gantt charts.
Basic timeline charts can be created using Excel, PowerPoint, MS Project, or various online services. However, if you want to build a web app with project management functionality but no external dependencies and cut costs on expensive third-party licenses for your end-users, you can embed special JavaScript timeline libraries like DHTMLX Gantt and Scheduler.
JavaScript Timeline Functionality in DHTMLX Gantt
A Gantt chart, in fact, is a form of a timeline that depicts the project workflow. It helps project managers to schedule tasks, allocate them between employees, and monitor their completion. But most importantly, Gantt charts give a chance to specify dependencies between tasks and calculate the critical path, thereby providing the management team with all necessary data to finish the project in time.
![DHTMLX Gantt]() Gantt chart based on DHTMLX Gantt
Gantt chart based on DHTMLX Gantt
DHTMLX HTML5 Gantt chart offers a variety of time configuration variants for the JavaScript timeline. Gantt charts can have any number of time scales with different time units (year, month, week, etc.). It is possible to define a specific time range and time step to be displayed on the screen. For example, you can set a daily or weekly time step within a monthly time range or even specify the timeline in minutes within one day. Besides, you can adjust the timescale entirely to your needs by adding custom time units such as fiscal quarters and years.
To make the work with large amounts of data more convenient, the DHTMLX Gantt widget allows swiftly navigating through the timeline using a mouse scroller.
![Drag Gantt JavaScript timeline chart]() Navigating the timeline with a mouse scroller. Check the sample >
Navigating the timeline with a mouse scroller. Check the sample >
Taking advantage of a special zooming module, users are able to toggle between Gantt chart scales or even zoom the timeline using the mouse wheel.
![Zooming timeline]() Zooming the timeline using the mouse wheel. Check the sample >
Zooming the timeline using the mouse wheel. Check the sample >
Other aspects of the timeline scale such as height, date format, and styling can also be modified according to the needs of users.
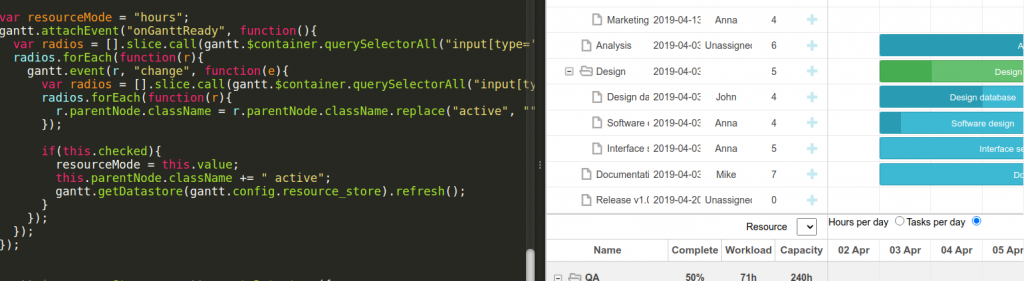
Among useful JavaScript timeline settings of DHTMLX Gantt, there is the ability to display only working hours and hide unnecessary dates like weekends.
![Timeline without weekends]() Not showing weekends on the timescale. Check the sample >
Not showing weekends on the timescale. Check the sample >
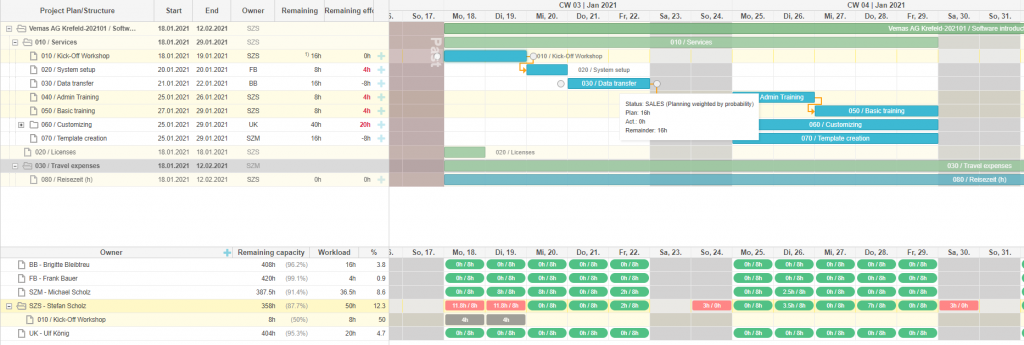
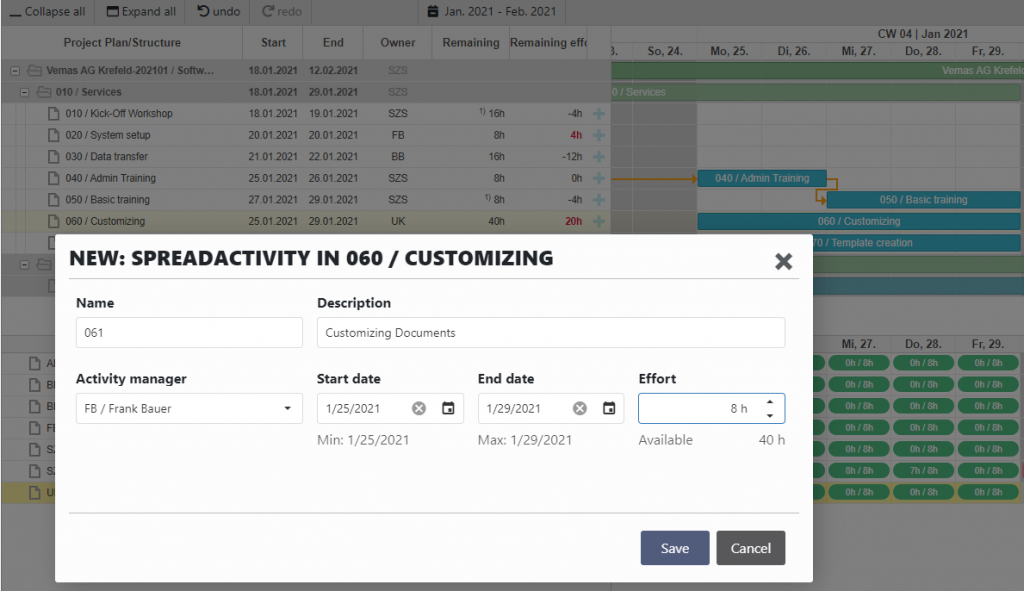
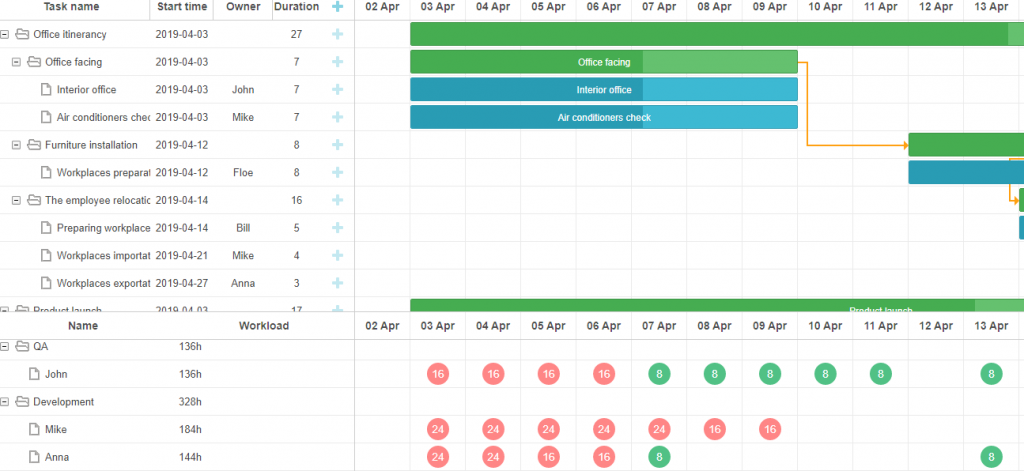
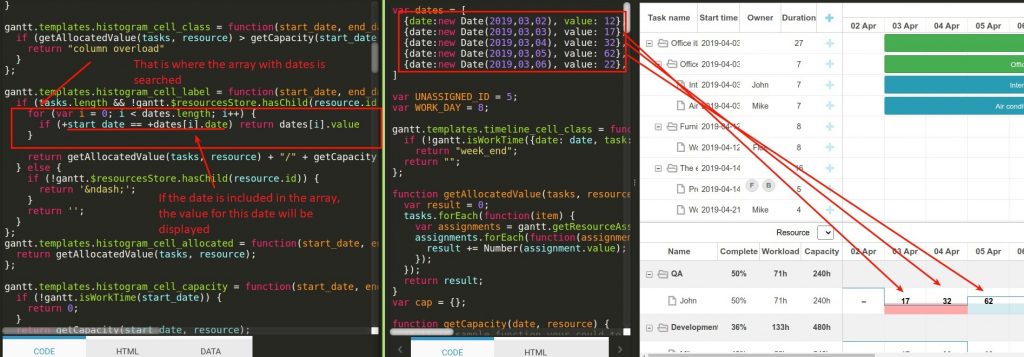
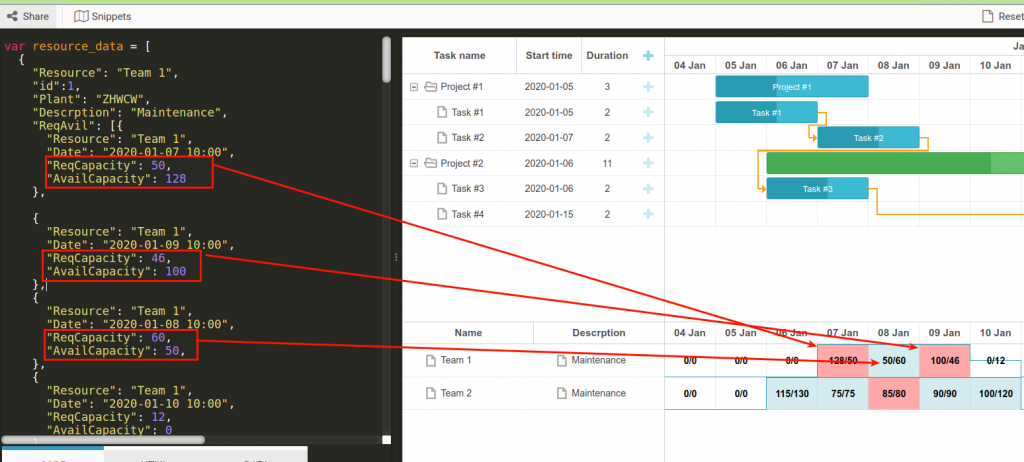
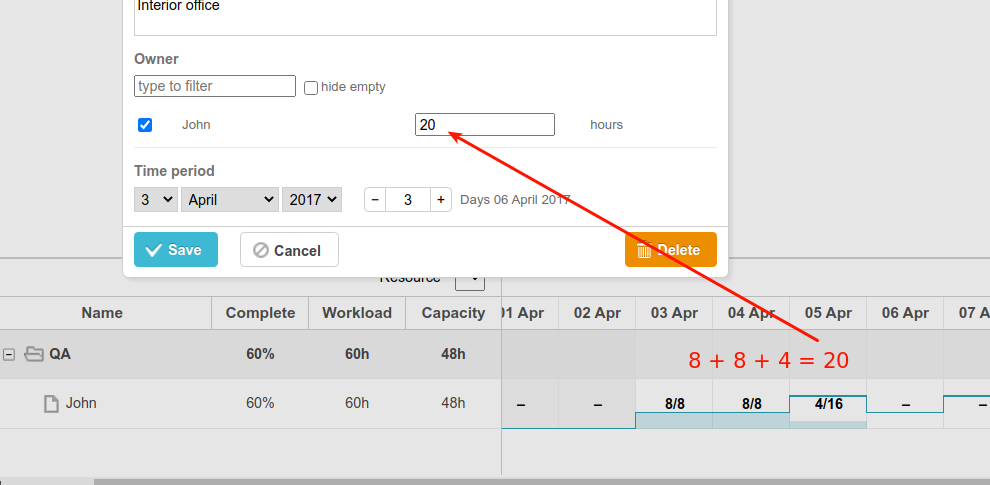
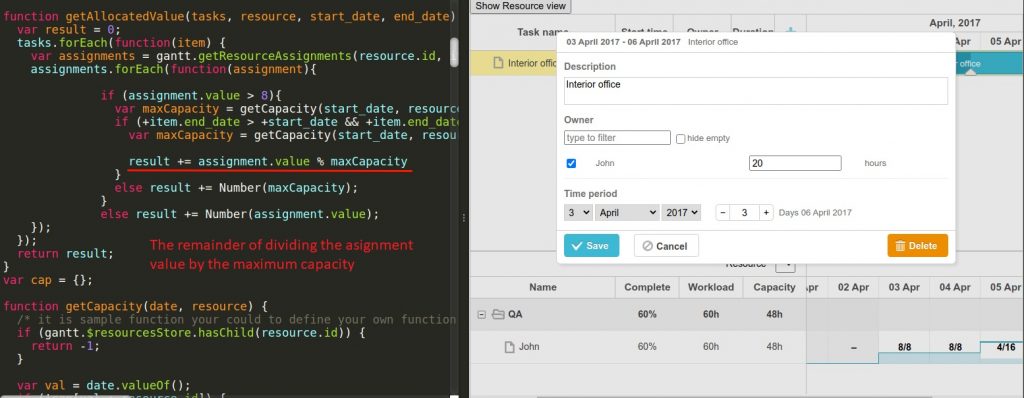
Thanks to a flexible layout, Gantt charts can be complemented with additional grids and timelines. For example, the resource panel can be added to the default timeline for managing project resources. It contributes to achieving more productive resource allocation and balanced workload intensity.
![DHTMLX Gantt - Resource Panel - Timeline]() Gantt chart with the resource panel. Check the sample >
Gantt chart with the resource panel. Check the sample >
DHTMLX Gantt supports the right-to-left (RTL) mode. In other words, the Gantt timeline can display textual data written in languages belonging to left-to-right writing systems (Arab, Persian, Hebrew, etc).
![DHTMLX Gantt - RTL mode]() Gantt Chart in the RTL mode. Check the sample >
Gantt Chart in the RTL mode. Check the sample >
JavaScript Timeline View in DHTMLX Scheduler
When it comes to visualization of appointments, events or crucial milestones within the project without displaying its intricacies such as task relationships, then it is better to opt for the DHTMLX JavaScript event calendar.
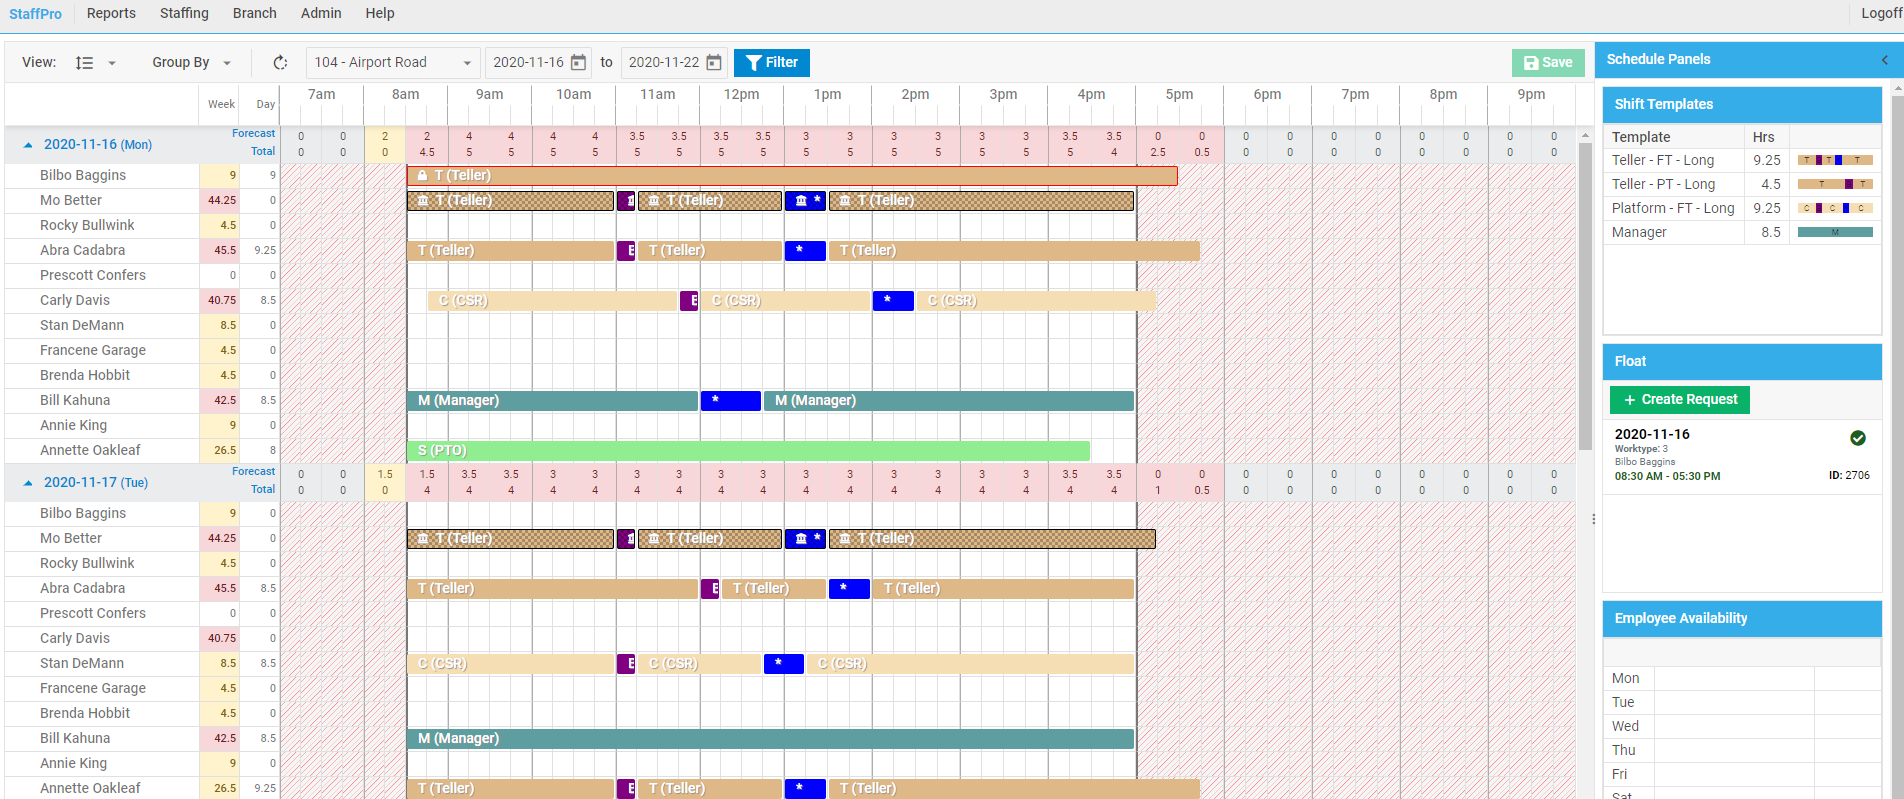
![JavaScript Timeline view]() Timeline view of the event calendar. Check the sample >
Timeline view of the event calendar. Check the sample >
The main peculiarity of DHTMLX Scheduler is the availability of 10 event calendar views that cover all the needs of end-users regarding the display of important project undertakings. The JavaScript Timeline view is one of the most widely used views designed to showcase events or tasks assigned to resources along the timeline. Under resources, we usually mean project members responsible for tasks, meeting rooms where appointments take place, or accommodation and vehicles available for booking.
The Timeline view has four modes: bar, days, cell, and tree. In the bar mode events are drawn with the help of bars, which may occupy several time slots. The days mode enables developers to show days as timeline rows. The cell mode illustrates events in a matrix of cells. Several events can be appointed on the same day with the number of appointed events shown inside cells.
![Scheduler - Timeline - Cell mode]() Cell mode of the Timeline view. Check the sample >
Cell mode of the Timeline view. Check the sample >
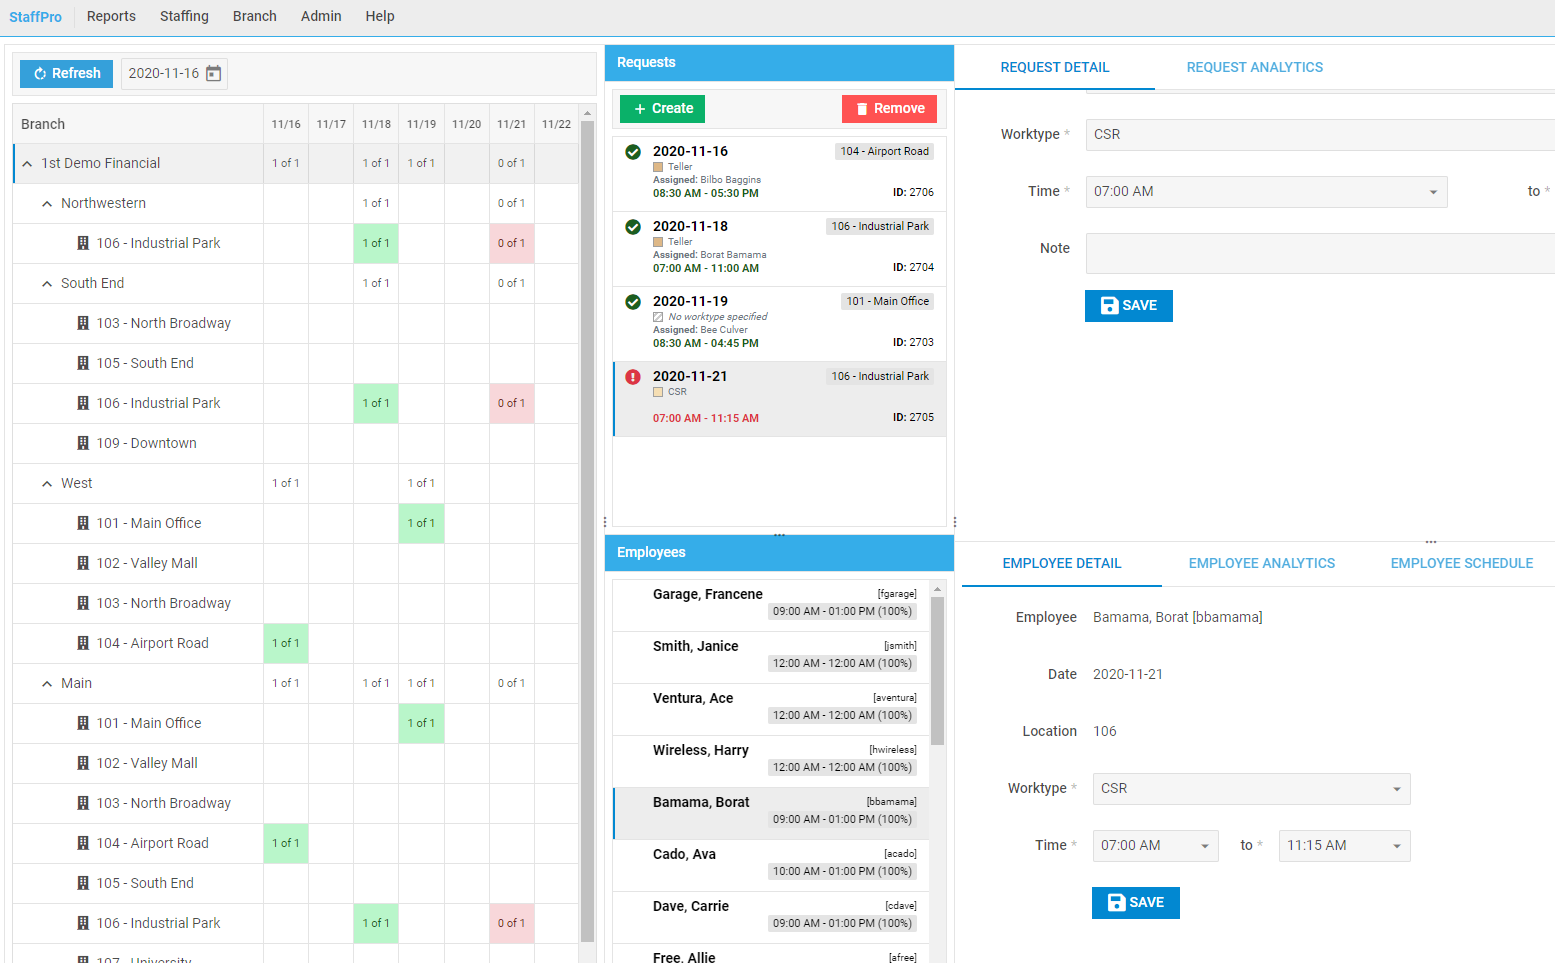
The tree mode allows organizing resources in a hierarchical tree structure on the Y-axis. For example, the Timeline view can demonstrate the work of departments and employees engaged in each department.
![DHTMLX Scheduler - Timeline view - Tree mode]() Tree mode of the Timeline view. Check the sample >
Tree mode of the Timeline view. Check the sample >
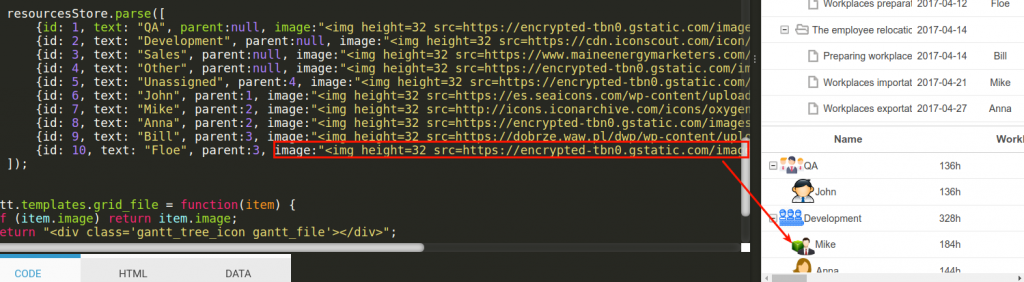
Moreover, it is possible to apply custom HTML content in all modes of the Timeline view. The sample below shows custom elements revealing the total quantity of tasks assigned to each manager.
![DHTMLX Scheduler - Timeline View - Custom Content]() Custom HTML content in the Timeline view. Check the sample >
Custom HTML content in the Timeline view. Check the sample >
The view comes with a horizontal scroll that makes it easier to browse through the whole calendar and find a specific event in no time. More than that, there is the auto-scroll feature, enabling project managers to change the time frames of calendar appointments by simply dragging them along the timeline.
![DHTMLX Scheduler - Timeline view - Horizontal Scroll]() Navigating through the calendar using the horizontal scroll. Check the sample >
Navigating through the calendar using the horizontal scroll. Check the sample >
The Scheduler component also allows setting up the second scale (X-axis) in the calendar timeline. An additional time scale is intended for grouping time spans of the default scale.
As the Gantt chart library, DHTMLX Scheduler supports smart rendering, thereby significantly enhancing the performance of the Timeline view. It can be very useful in data-intensive projects.
While dealing with different events, the project management office can take advantage of numerous helpful features embedded in DHTMLX Scheduler such as recurring events, custom tooltips, multisection events, multilanguage support, etc.
Final Words
Time is a key metric in any business endeavor and timeline charts aid in organizing timeframes in such a way that projects can be delivered without delays. There are numerous software solutions for project management already available on the market. But integrating a JavaScript library instead of using a costly external service can be a win-win for software development companies and their clients.
DHTMLX provides out-of-the-box controls with rich timeline functionality, which can be easily embedded into web applications. Extensive API and full customization of the DHTMLX planning tools enable programmers to adjust the components to their requirements. Thanks to a short learning curve and rapid technical support, developers won’t need much time to master DHTMLX.
If you have become interested in testing DHTMLX JavaScript timeline controls, download 30-day trial versions of Gantt and Scheduler widgets.
DHTMLX libraries can be purchased separately as well as in a bundle complemented with the PDF/PNG and MS Project export modules at a discount.
Related Materials:
The post JavaScript Timeline Chart Functionality in DHTMLX appeared first on DHTMLX Blog.
 That’s how a standard timeline chart looks like
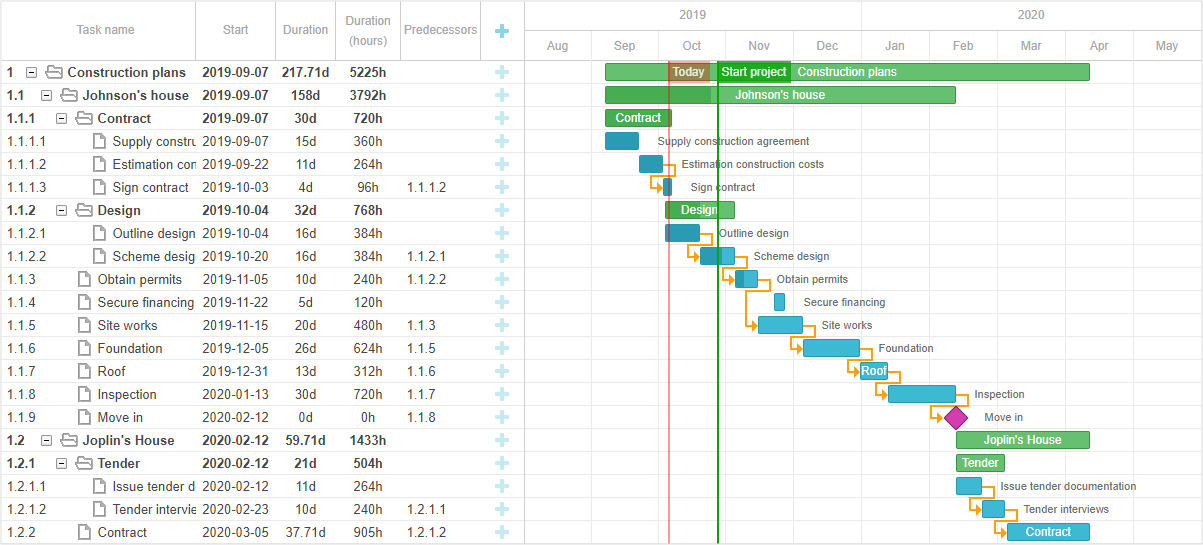 Gantt chart based on DHTMLX Gantt
 Navigating the timeline with a mouse scroller.
  Zooming the timeline using the mouse wheel.
 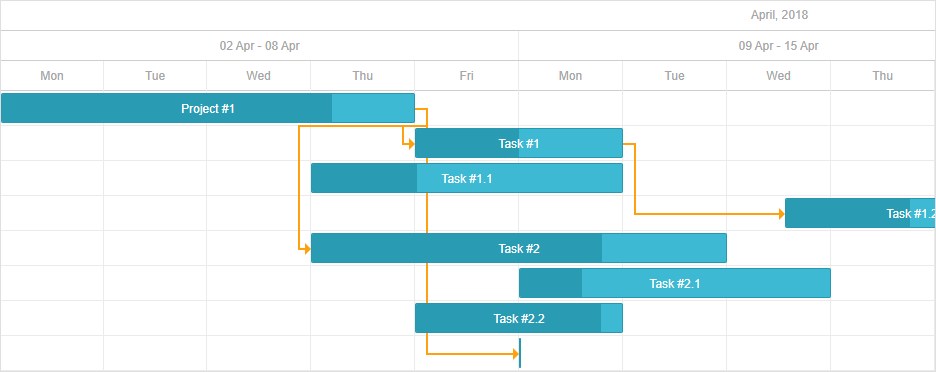 Not showing weekends on the timescale.
 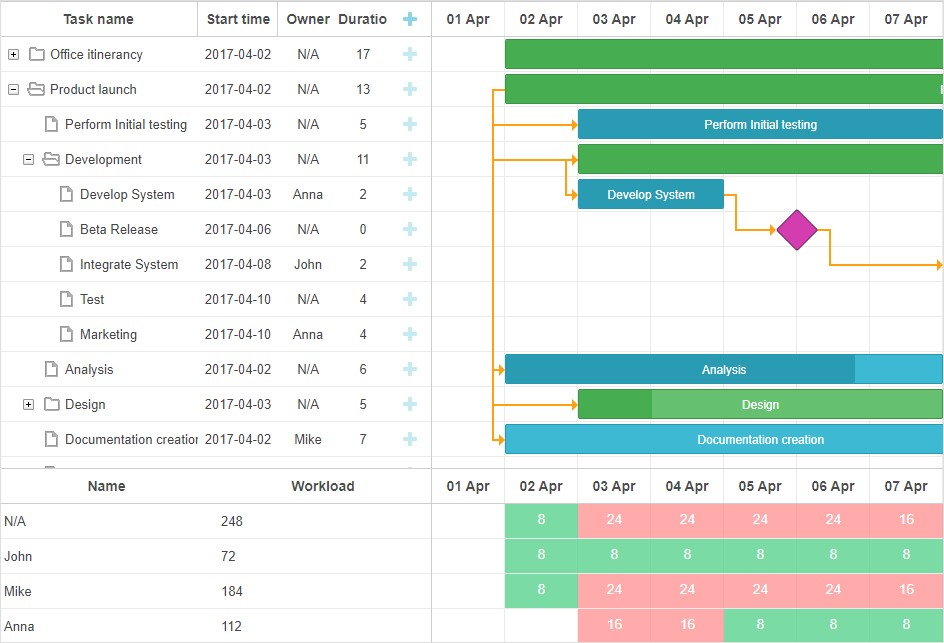 Gantt chart with the resource panel.
 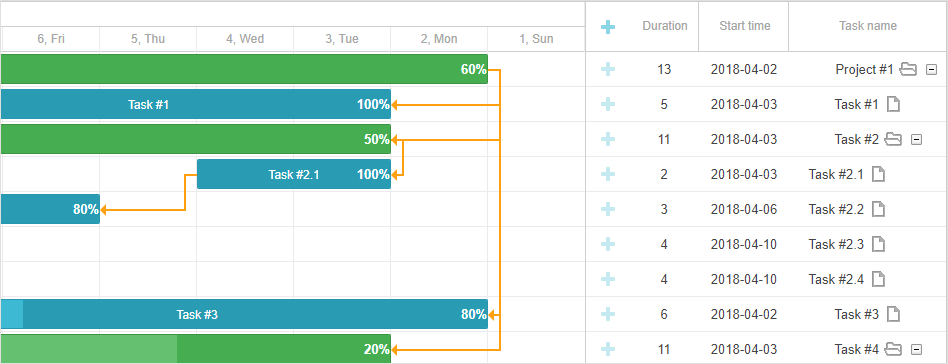 Gantt Chart in the RTL mode.
 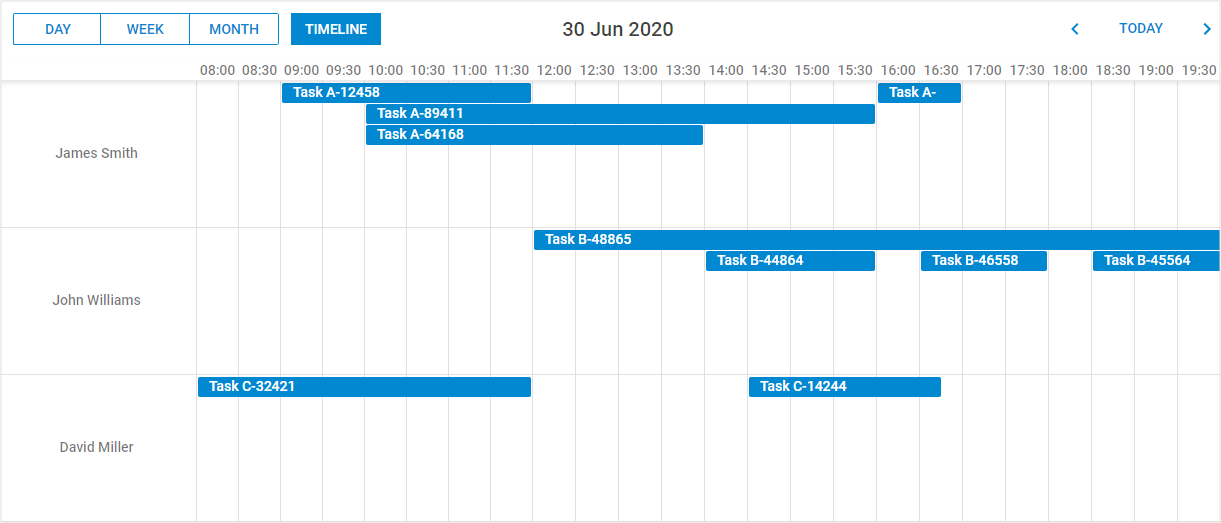 Timeline view of the event calendar.
 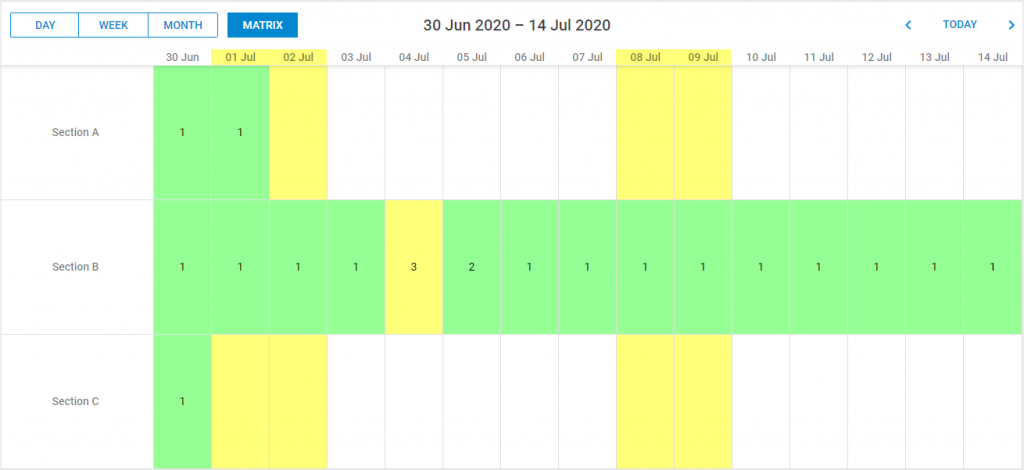 Cell mode of the Timeline view.
 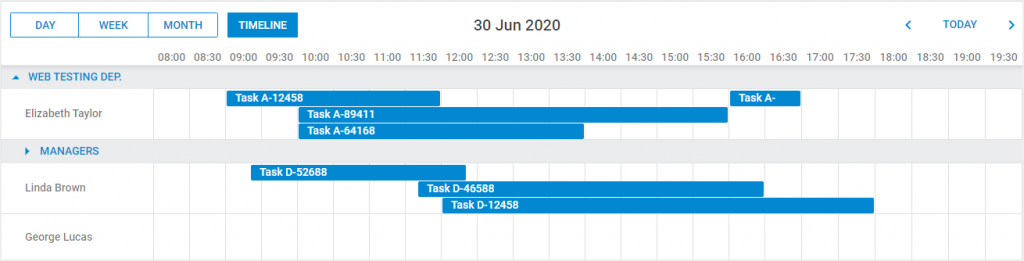 Tree mode of the Timeline view.
 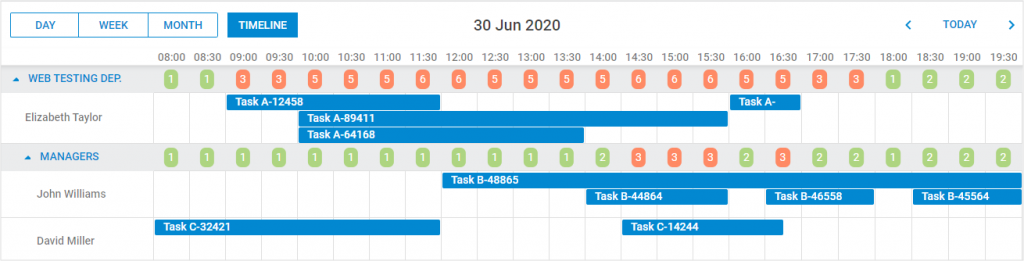 Custom HTML content in the Timeline view.
  Navigating through the calendar using the horizontal scroll.