Quantcast
Channel: DHTMLX Blog
Viewing all 228 articles
Browse latest View live

How to set up inline editors and edit JavaScript Gantt data on the fly

$
0
0

An essential feature of Gantt charts is the ability to edit projects’ data quickly. In this video tutorial, we’re going to share tips on how to set up inline editing and enable end-users to create and change Gantt tasks right from the UI.

There are two ways of how end-users can edit Gantt data:

  • using the Lightbox edit form;
  • via inline editors in the Grid area.

Inline editors give users a great advantage over the lightbox form speeding up the process of editing tasks and interacting with our HTML Gantt chart. Thus, all changes into Gantt data like creating or updating tasks, connecting them, and defining task dates and duration, can be made right through the grid via built-in editors.

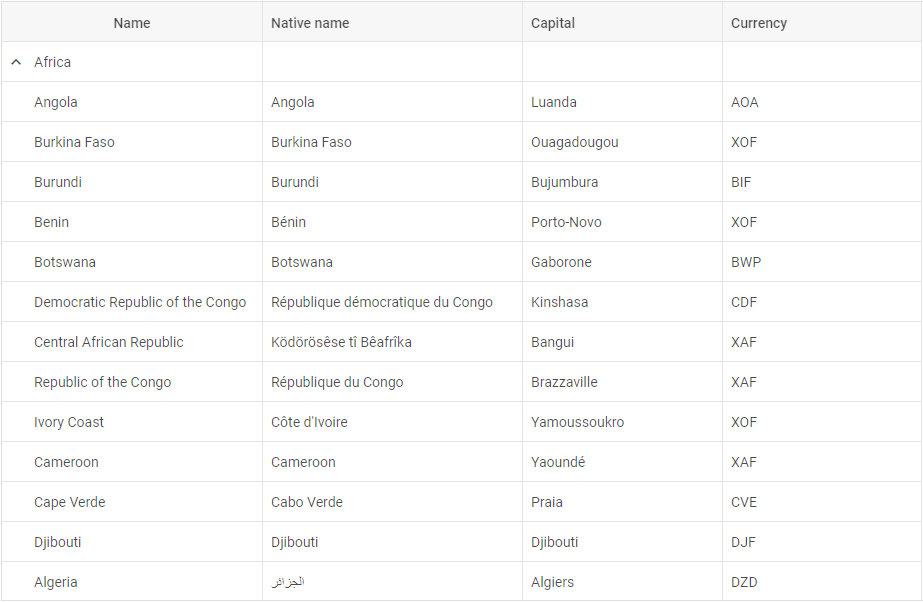
Built-in editors for editing Gantt data from the UI

Let’s dive deeper into the settings of DHTMLX Gantt inline editors.

You can make Gantt column editable by adding the editor property to it:

var textEditor = {type: "text", map_to: "text"};
var dateEditor = {type: "date", map_to: "start_date", min: new Date(2020, 0, 1), max: new Date(2021, 0, 1)};
var durationEditor = {type: "number", map_to: "duration", min:0, max: 100};

gantt.config.columns = [
     {name: "text", tree: true, width: '*', resize: true, editor: textEditor},
     {name: "start_date", align: "center", resize: true, editor: dateEditor},
     {name: "duration", align: "center", editor: durationEditor},
     {name: "add", width: 44}
];

The editor object should have the type property that should match one of the defined types of editors and the map_to property that binds the editor to the property of the task object.

The rest of the settings are specific to certain types of editors. For example, you can specify minimum and maximum values for the number and date editors.

You can also define a new type of editor by adding a specially formatted object into the Gantt config. The public API of editors is quite extensive, providing methods and events to control every aspect of their work.

How to create a custom inline editor

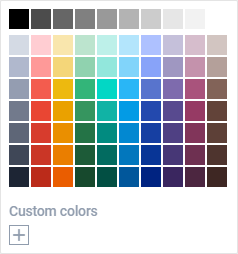
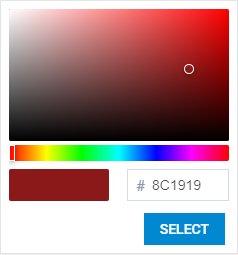
Let’s say you need to specify the colors of Gantt tasks. There is no built-in color picker in the grid of Gantt for changing tasks’ colors, so let’s set up a custom inline editor on our own.

To do so, firstly, we need to add an extra column to the grid of Gantt and place a color picker inside. We can take a simple HTML5 color input for a start.

Let’s copy the code example from the documentation and use it as a template:

gantt.config.editor_types.color = {
  show: function (id, column, config, placeholder) {
        var html = "<div><input type='color' name='" + column.name + "'></div>";
        placeholder.innerHTML = html;
  },
  hide: function () {},
  set_value: function (value, id, column, node) {
    this.get_input(node).value = value;
  },
  get_value: function (id, column, node) {
    return this.get_input(node).value || "";
  },
  is_changed: function (value, id, column, node) {
    var input = this.get_input(node);
    return input.value !== value;
  },
  get_input: function(node) {
    return node.querySelector("input");
  },
  is_valid: function (value, id, column, node) {
    var input = this.get_input(node);
    return !!input.value;
  },
  focus: function(node){
    var input = this.get_input(node);
    input.focus();
  }
}

Make sure to rename the control and change the show function to create a color input.

We won’t need the hide method since our input doesn’t need any destructor or post-processing after it’s hidden, so we can leave it empty.

The next two important methods are set_value and get_value. The former is called when the editor is opened to populate it with the value from the task. And the latter is called when the user saves the editor; the return value will be applied to the task object.

The next step is the is_changed function. Since editors can be opened and closed easily, we only want to trigger data change when the user has modified the editor value. Inside this method, we’ll need to compare the initial value provided to the editor with the current one and return boolean true if values differ. Returning true will update the task with the new value, returning false will simply close the editor.

The is_valid method works as it sounds, returning false will tell Gantt that the input value is not valid and should be discarded.

The save method is needed for complex editors (such as predecessor selectors) that make multiple changes rather than modify a single property of a task. So let’s delete it.

And finally, the focus method that should put a browser focus into our editor.

Now we have a ready-to-use inline editor for selecting task colors.

The next step is to add a new column to the grid config and attach the editor config to it. Note that the type property of the color editor must match the name we used for our editor above. The map_to value will define the property of the task object for the editor to write values to. We use the color property there since Gantt will automatically apply colors from this property:

var textEditor = {type: "text", map_to: "text"};
var dateEditor = {type: "date", map_to: "start_date", min: new Date(2020, 0, 1), max: new Date(2021, 0, 1)};
var durationEditor = {type: "number", map_to: "duration", min:0, max: 100};
var colorEditor = {type: "color", map_to: "color"};
 
gantt.config.columns = [
    {name: "text", tree: true, width: '*', resize: true, editor: textEditor},
    {name: "start_date", align: "center", resize: true, editor: dateEditor},
    {name: "duration", align: "center", editor: durationEditor},
    {name: "color", align: "center", label:"Color", editor: colorEditor},
    {name: "add", width: 44}
];

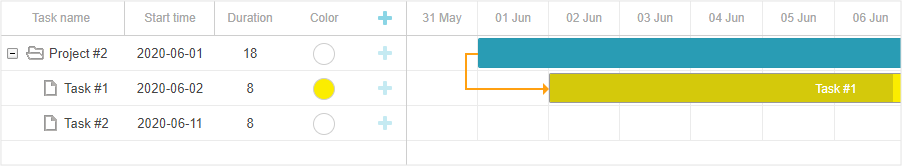
Now if we add some values to the data you should see it in action:

Color picker in DHTMLX Gantt

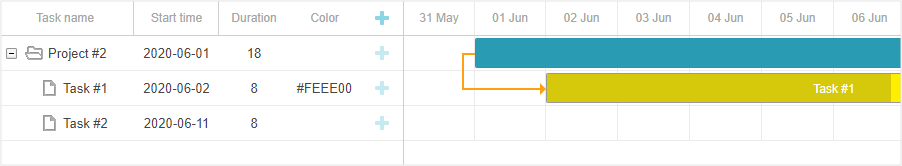
As a final touch, we’ll properly display colors inside the color column. It’s done via a template the way we showed you in one of our previous video tutorials. We’ll define a template that will return a div element with a specified background color style:

{name: "color", align: "center", label:"Color", editor: colorEditor, template:
    function(task){
        return "<div class='task-color-cell' style='background:" + task.color + "'></div>"
}},

And apply some styles to display it correctly:

.task-color-cell{
  margin:10%;
  width:20px;
  height:20px;
  border:1px solid #cecece;
  display:inline-block;
  border-radius:20px;
}

HTML5 color picker in DHTMLX GanttCheck the sample >

How to create an inline editor with a third-party color picker

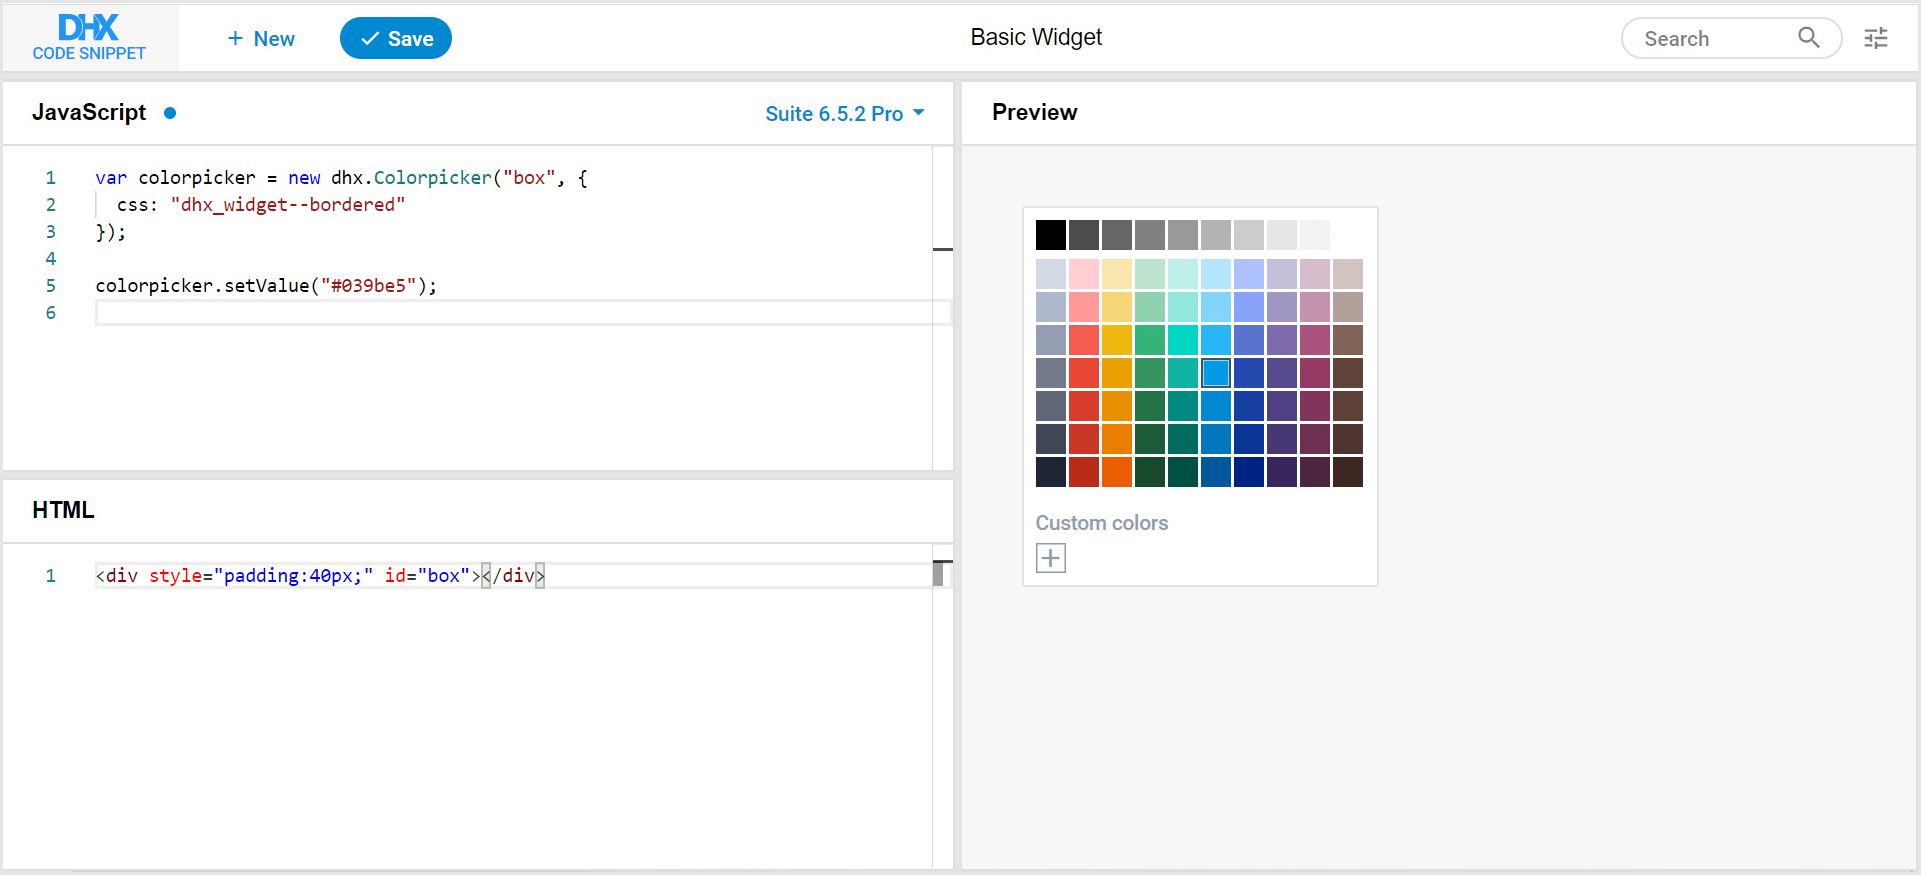
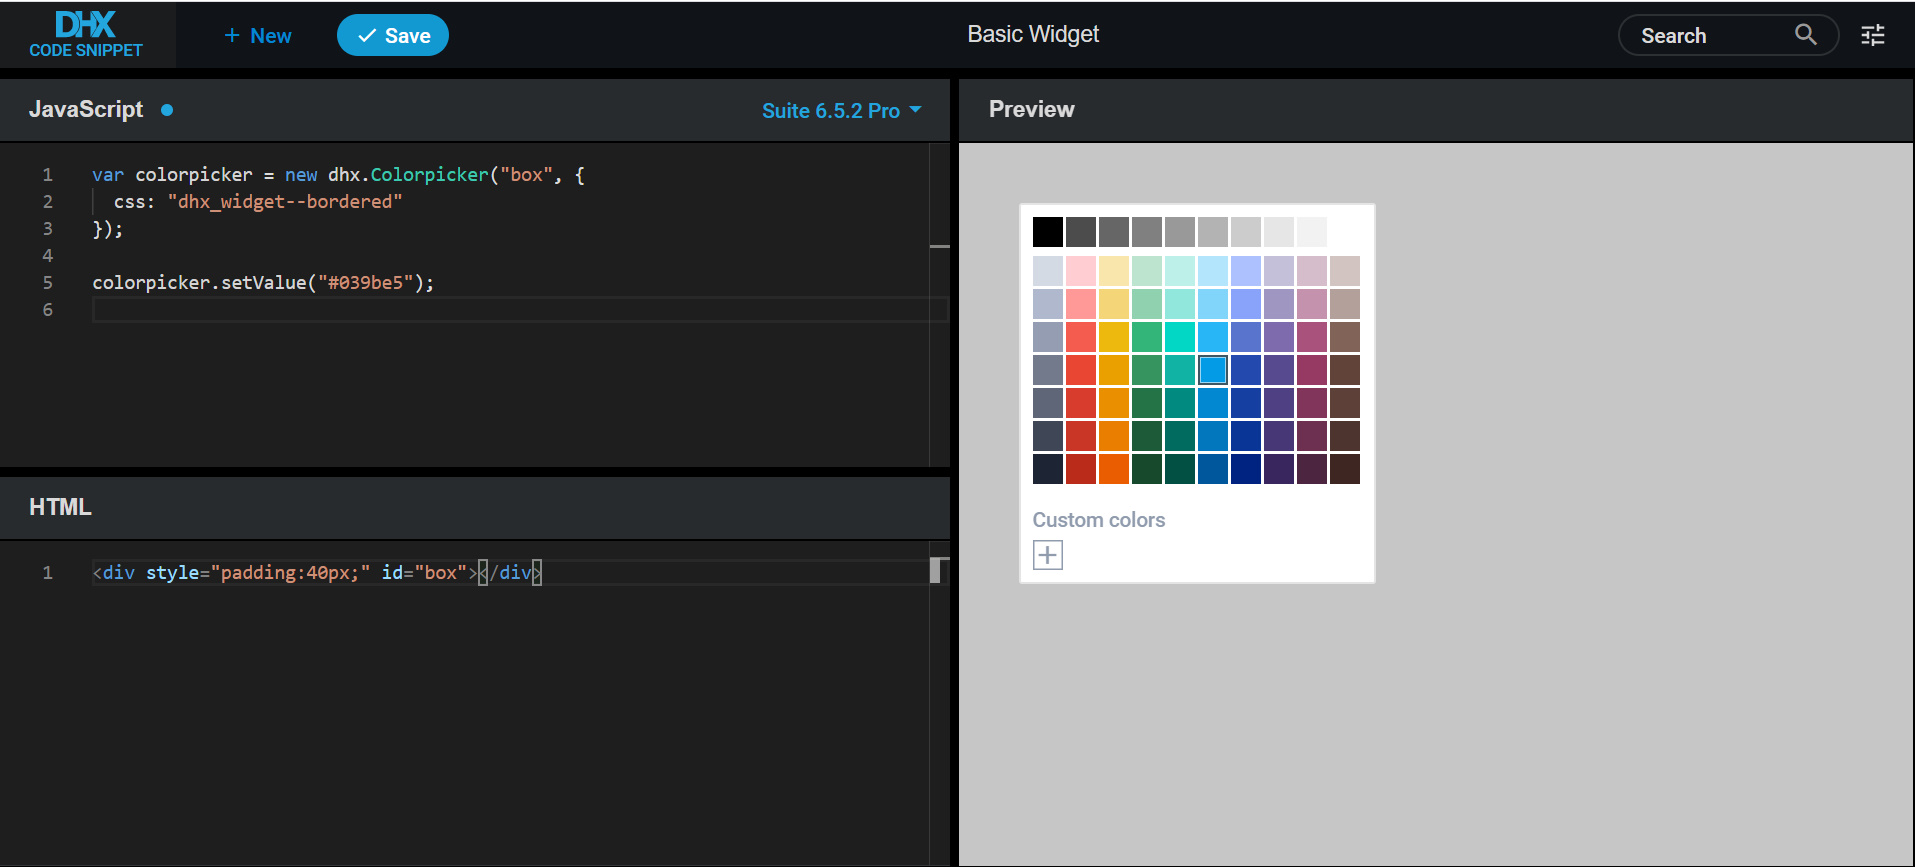
In case you want to use a proper color picker widget, the code won’t differ a lot. We can integrate a third-party color picker such as a jquery plugin named Spectrum.

The first step is to add the files of the Spectrum library to our sample.

After that, update our control. We’ll define a variable where we’ll store a reference to our editor instance. We’ll need it to call a destructor when the input is hidden:

var editor;
gantt.config.editor_types.color = {
  show: function (id, column, config, placeholder) {
        var html = "<div><input type='color' name='" + column.name + "'></div>";
        placeholder.innerHTML = HTML;

        editor = $(placeholder).find("input").spectrum({
          change: function(){
            gantt.ext.inlineEditors.save();
          }
        });
        setTimeout(function(){
          editor.spectrum("show");
        })
  },
  hide: function () {
    if(editor){
      editor.spectrum("destroy");
      editor = null;
    }
  },
  set_value: function (value, id, column, node) {
    editor.spectrum("set", value);
  },
  get_value: function (id, column, node) {
    return editor.spectrum("get").toHexString();
  },
  is_changed: function (value, id, column, node) {
    var newValue = this.get_value(id, column, node);
    return newValue !== value;
  },
  is_valid: function (value, id, column, node) {
    var newValue = this.get_value(id, column, node);
    return !!newValue;
  },
  focus: function(node){
    editor.spectrum("show");
  }
}

First, we need to modify our show method. When it’s called we need to initialize and display the color picker widget. Note that in our example we call the show method from a timeout. It’s needed to ensure that we’ll attempt to display it after all HTML elements are inserted into the document.

Next, we’ll need to define the hide method. We’ll call the destructor when the editor is closed.

The rest of the methods are relatively intuitive and don’t differ too much from our original implementation. We need to modify the way the value is obtained from the control.

After it’s done everything should work as expected.

DHTMLX Gantt with built-in color pickerCheck the sample >

Ready to try it out yourself? Download a free Gantt trial version and follow our video tutorial!

Previous tutorials from the series:

If you’re interested in any other topics for building your own Gantt chart, leave your thoughts in the comment section below and follow DHTMLX youtube channel to stay tuned!

The post How to set up inline editors and edit JavaScript Gantt data on the fly appeared first on DHTMLX Blog.


DHTMLX Suite 6.5: TypeScript Definitions, Grid and TreeGrid Columns’ Drag-n-Drop, Grouping TreeGrid Data, and New Angular Demo

$
0
0

The summer season at DHTMLX opens with a major release of our JavaScript UI library – Suite 6.5.

The update accommodated some highly demanded features requested by our clients like TypeScript support, grouping TreeGrid data, and drag-n-drop of columns in Grid and TreeGrid. Besides, our development team designed new examples of using Suite UI components with Angular. Other features and improvements cover new configuration options and methods for manipulating content in Grid and TreeGrid, List and DataView, and managing Form controls and Sidebar options.

Jump into evaluating Suite UI library 6.5 free of charge for 30 days right now.

Or read the release article to take in every detail.

Built-in TypeScript Definitions

As TypeScript gained considerable popularity among web developers and its support was particularly demanded by our users, we incorporated TypeScript definitions into our UI components.

From now on, built-in type definitions will help you save time and write clean and stable code with the help of type suggestions, autocompletion, and type checking. Check how it works in our code snippet >
TypeScript support for UI components - DHTMLX Suite

Angular Examples

Together with the release of Suite 6.5, our dev team prepared examples of all Suite components with Angular. The examples cover basic initialization and usage as well as event listening. The full source code of our components used with Angular can be found on GitHub.

To get the idea of how it works, have a look at the initialization of DHTMLX Calendar with Angular:

import { Output, Component, ViewChild, OnDestroy, ElementRef, EventEmitter } from '@angular/core';
import { Calendar as CalendarDHX } from 'dhx-suite';

@Component({
    selector: 'app-calendar',
    template: `<div #widget></div>`,
})
export class CalendarComponent implements OnDestroy {
  @ViewChild('widget', { static: true })
  container: ElementRef;
  calendar: CalendarDHX;
  wait: Promise<void>;

  @Output() ready: EventEmitter<any> = new EventEmitter();

  ngOnInit() {
    this.calendar = new CalendarDHX(this.container.nativeElement, {
      css: 'dhx_widget--bordered',
      value: new Date(),
    });
  }

  ngOnDestroy() {
    this.calendar && this.calendar.destructor();
  }
}

Check full source code on GitHub >

Besides, our team revised DHTMLX React examples on GitHub and got down to preparing samples with Vue.js.

Dragging and Dropping Columns in Grid and TreeGrid [PRO]

Drag-n-drop of columns in DHTMLX Grid and TreeGrid
Check the snippet >

In addition to reordering rows, starting from v6.5, it became possible to move Grid and TreeGrid columns via drag-n-drop. To enable this functionality, you only need to specify the dragItem: “column” property in the configuration of Grid or TreeGrid:

var grid = new dhx.Grid("grid_container", {
      columns: [// columns config],
      dragItem:"column",      
      data: dataset
});

If you need to prevent a particular column from being moved, you can add the draggable: false option to its config:

var grid = new dhx.Grid("grid_container", {
    columns: [
        { width: 200, id: "country", header: [{ text: "Country" }], draggable: false },        
        { width: 150, id: "land", header: [{ text: "Land" }] },
        { width: 150, id: "density", header: [{ text: "Density" }], draggable: false }    
    ],
    data: dataset,
    dragItem: "column",  
});

To help you customize the user experience, we enlarged the list of events with new ones: beforeColumnDrag and beforeColumnDrop, which fire before users drag and drop columns.

Grouping TreeGrid Data

Another long-awaited feature of Suite 6.5 is the ability to group data in TreeGrid columns according to specific criteria.

A basic example is grouping TreeGrid data by values of a particular column. In order to implement this functionality, you need to make use of the groupBy() method and pass the id of the column as its parameter:

treegrid.groupBy("age");

However, some use cases presuppose a more advanced approach. For instance, we need to group countries according to their size and split them into three categories: small, medium, and big. TreeGrid enables you to pass a function with a rule as a parameter to the groupBy() method, which will determine how to group data.

In the example below, we define that all countries with an area less than 25000 square km fall into the “Small” group, while the “Medium” group includes countries smaller than 60000 square km. If there are countries with values less than 0, they are categorized as N.A. The rest of the countries constitute the “Big” group:

Grouping TreeGrid data by areaCheck the sample >

treegrid.groupBy(function (item) {
    if (!item.area || item.area < 0) {
        return "N.A.";
    }
    if (item.area < 25000) {
        return "Small";
    } else if (item.area < 60000) {
        return "Medium";
    }
    return "Big";
});

Moreover, you can modify the title of a group by setting a template with the help of the groupTitleTemplate configuration option. Thus, you can include the group name and any other attributes you need there. For instance, in the sample below, group titles include not only their names but also the calculated average density of countries:
Grouping TreeGrid data by densityCheck the sample >

groupTitleTemplate: function(groupName, items) {
     return groupName + " (Avg. Density: " + Math.floor(items.reduce((acc, i) => acc + Number.parseInt(i.density), 0)/items.length) + ")";
}
Changing the Alignment of Columns in Grid and TreeGrid

V6.5 enriched the abilities of Grid and TreeGrid with one more configuration option for aligning the content of columns and their headers. The new align config allows you to implement left, right, or center alignment of content:

var grid = new dhx.Grid("grid_container", {
      columns: [
               { id: "name", header: [{ title: "Name", align: "center" }], align: "left"}
              // more options
      ],
     data: dataset
});

Alignment of columns in DHTMLX GridCheck the sample >

Disabling Tooltips in Grid and TreeGrid

Another enhancement concerns the usage of tooltips in DHTMLX Grid and TreeGrid. From now on, you can disable tooltips for any chosen element of these components: entire columns or specific cells.

Disabling tooltips in DHTMLX TreeGridCheck the sample >

It can be done via the tooltip configuration option like in the example below:

var treeGrid = new dhx.TreeGrid("treegrid", {
      columns: [
    { width: 280, id: "name", header: [{ text: "Book Name" }], tooltip: true },
    { width: 160, id: "price", type: "string", header: [{ text: "Terms and conditions", colspan: 2 }, { text: "Price" }] },
    { width: 160, id: "cover", type: "string", header: [{}, { text: "Cover" }] },
    { width: 160, id: "ships", type: "string", header: [{ text: "Ships in" }] },
    { width: 160, id: "inStock", type: "string", header: [{ text: "In stock" }] }
    ],
    data: dataset,
    tooltip: false
});
Adjusting Columns’ Width to Their Footer in Grid and TreeGrid

As a final touch, we updated the adjust property in the configuration of Grid and TreeGrid components. Now the width of columns (all at once or separate ones) can be adjusted to the width of their footer:

var grid = new dhx.Grid("grid_container", {
    columns: [// columns config],
    adjust: "footer",    
    data: dataset
});

Adjusting columns' width in GridCheck the sample >

Manipulating the Selection of Items in DataView and List

V6.5 provides you with the ability to manage the selection of DataView and List items with the help of the newly introduced configuration options and methods.

Starting with v6.5, the selection configuration property serves to enable and disable items selection:

var dataview = new dhx.DataView("dataview", {
    selection: false
});

Besides, you can apply the enableSelection and disableSelection methods for this purpose.

Manipulating the Visibility of Form and its Controls

V6.5 delivered plenty of new methods and options for improving your work with DHTMLX Form.

Now it’s much easier to manage the visibility of the entire Form as well as separate controls. You can make a form hidden via the new hidden configuration property or using the hide method. The show method makes a form visible. The isVisible method enables you to check if a form is visible at the moment.

You can apply the same methods to manipulate the visibility of Form controls (buttons, input fields, select boxes, etc.). In order to add interactivity to your form, you can attach new event handlers to Form controls: afterHide, afterShow, beforeHide, and beforeShow.

Besides, we enriched the abilities of the select control and simpleVault control.

Now you can get an array of all options of the select control via the getOptions() method. The setOptions() method enables you to modify select options dynamically.

New methods of the simpleVault control allow you to open the dialog box and select files for uploading via the selectFile() method, send a POST request for uploading files to the server via the send() method and specify the default list of loaded files via the setValue() method.

Selecting Sidebar Items

DHTMLX Sidebar was also updated with new methods for selecting and deselecting Sidebar options as well as checking if an option is selected or not. Check the sample >

Now that you have learned about the update of our Suite UI library v6.5, we invite you to test all the components during a free 30-day evaluation period.

We’re looking forward to your feedback – feel free to let us know what you think in the comment section below or via our email: contact@dhtmlx.com.

Current clients are invited to download the latest version in their Client’s Area.

Stay safe and stay tuned for DHTMLX summer updates!

Get Free Trial v6.5 Now

Related Materials:

The post DHTMLX Suite 6.5: TypeScript Definitions, Grid and TreeGrid Columns’ Drag-n-Drop, Grouping TreeGrid Data, and New Angular Demo appeared first on DHTMLX Blog.

Vue.js Integration for Suite UI Components

$
0
0

After delivering integration examples with two widely used frameworks: Angular and React, we settled down to Vue.js. You can find live samples of Suite UI components together with the full source code that you can use in your Vue-based apps on our GitHub Pages.

Examples of UI components with Vue.js are divided into five sections:

  • Basic initialization via npm
  • Preconfigured component
  • Work with data
  • Basic initialization via CDN
  • Event listening

Each component has a link to its documentation to help you grasp all configuration options.

Let’s take a look at the example of DHTMLX Colorpicker initialized using Vue.js via npm:

<template>
  <div ref="colorpicker"></div>
</template>

<script>
import { Colorpicker as ColorpickerDHX } from "dhx-suite";
export default {
  name: "ColorpickerBase",
  data: () => ({
    colorpicker: null,
  }),
  mounted() {
    this.colorpicker = new ColorpickerDHX(this.$refs.colorpicker);
  },
  beforeDestroy() {
    if (this.colorpicker) {
      this.colorpicker.destructor();
    }
  },
};
</script>

View full source code >

DHTMLX Colorpicker with Vue.jsView live demo >

Here is our Colorpicker widget based on Vue.js in the picker mode only:

<template>
  <div ref="colorpicker"></div>
</template>

<script>
import { Colorpicker as ColorpickerDHX } from "dhx-suite";
export default {
  name: "ColorpickerConfigurated",
  data: () => ({
    colorpicker: null,
  }),
  props: {
    options: {
      type: Object,
      required: true,
    },
  },
  mounted() {
    this.colorpicker = new ColorpickerDHX(this.$refs.colorpicker, {
       pickerOnly: true
    });
  },
  beforeDestroy() {
    if (this.colorpicker) {
      this.colorpicker.destructor();
    }
  },
};
</script>

View full source code >

Picker mode of DHTMLX Vue.js ColorpickerView live demo >

Our Vue.js examples are intended for faster development of web applications based on Suite UI components. You can try our UI library for free during a 30-day evaluation period. Our official technical support team will provide you with guidance if any questions arise.

Related Materials:

The post Vue.js Integration for Suite UI Components appeared first on DHTMLX Blog.

How to Create a JavaScript UML Class Diagram with DHTMLX

$
0
0

UML class diagram plays a key role in representing a system’s structure visually. This type of diagram complements a variety of data visualization tools available in the DHTMLX Diagram library. You can download a 30-day free trial version of our Diagram library and create your own UML class diagrams following our step-by-step guide.

What is a UML class diagram

UML class diagrams are mostly used in software engineering for modeling the static structure of applications. They help business analysts to analyze a business domain and depict core business elements, which lay the foundation for a future app. Prepared by business analysts UML class diagrams provide developers with a clear understanding of the whole system structure.

The class diagram is the only UML diagram type that can be mapped directly with object-oriented languages including JavaScript. These diagrams make things much easier for developers in complex projects. That is why this visualization tool is extremely popular in the dev community.

UML class diagrams illustrate the following key elements of a system:

  • classes,
  • class attributes,
  • and relationships.
Example of a basic JavaScript UML class diagram

JavaScript UML class diagram

Let’s look at the example of a simple JavaScript UML class diagram made with DHTMLX.

Our example shows the structure of a basic reporting system administered by a company’s CEO. It consists of four classes: CEO, Project, Report, and Employee. The CEO manages projects of a company, assigns employees, and controls their reports. Straight and right-angled lines show the association relationships between classes.

Each class comprises a set of attributes necessary for the correct functioning of the reporting system. The CEO class includes credentials to log into the system: login and password. The Project class should have an ID in a number format, a name in a text format, tasks with IDs, and access rights for employees defined by their IDs. The Report contains time and date when it is created as well as tasks and projects to be reported on. The employee has an ID and credentials: login and password.

How to create a JavaScript UML class diagram with DHTMLX

Let’s walk through the whole process of creating a simple UML class diagram in JavaScript with DHTMLX.

1. Initialize DHTMLX Diagram library:

<!DOCTYPE html>
<html>
<head>
  <script type="text/javascript" src="codebase/diagram.js"></script>    
  <link rel="stylesheet" href="codebase/diagram.css">
</head>
<body>
    <div id="diagram"></div>
    <script>
       const diagram = new dhx.Diagram("diagram");
   </script>
</body>
</html>

At first, you need to add JS and CSS source files and a container to place a diagram on a page. Then you should use the dhx.Diagram constructor to initialize your diagram. The constructor has two parameters: container created at the very first step and object with configuration options.

2. Define the default configuration of shapes via the defaults config:

const defaults = {
        title: "Title",
        text: ["Text"],
        height: 90,
        width: 140,
        fill: "#CEEFE1",
        stroke: "#0AB169",
        strokeWidth: 2
    };

The defaults config can save you lots of time and lines of code when you specify the properties of diagram shapes. We have four similar UML class shapes colored in mint green with a 2px green stroke. All of them have a Title, which stands for the name of a class, and text, which describes class attributes. We may also set other options such as height and width commonly used in the configuration of shapes.

3. Create a template for custom shapes of the UML class diagram:

const template = config => (`
        <section class='template'
            style='
                background:${config.fill};
                border:${config.strokeWidth}px solid ${config.stroke}'
>
            <h3 style='border-bottom:${config.strokeWidth}px solid ${config.stroke}'>
                ${config.title}
            </h3>
            <ul>
                <li>${config.text.join("</li><li>")}</li>
            </ul>
        </section>
    `);

To create a UML class shape, you need to prepare an HTML template for it. We use the ES6+ format supported by modern browsers for the template of our shapes.

The template lets you specify all elements of the UML class shape: top part with a heading and bottom part with a list of attributes. You can also include style settings for the background and borders.

4. Add shapes to the UML class diagram:

diagram.addShape("template", {
        template,
        defaults
    });

When we have our template for shapes and default configuration done, we can add shapes to our JavaScript UML class diagram via the addShape method. This method allows for adding any kind of shapes created with the help of templates.

5. Prepare and parse data into the diagram:

const fullHtmlData = [
        // shapes
        {
            id: "s1",
            type: "template",
            title: "CEO",
            text: ["Login: Text","Password: Text"],
            fill: "#CEEFE1",
            stroke: "#0AB169",
            strokeWidth: 2,

            x: 200, y: 0, width: 140, height: 140,
        },
        {
            id: "s2",
            type: "template",
            title: "Report",
            text:["Time: Number","Date: Date","Task: Text","Project: Text"],
            fill: "#CEEFE1",
            stroke: "#0AB169",
            strokeWidth: 2,

            x: 350, y: 220, width: 140, height: 160,
        },
        {
            id: "s3",
            type: "template",
            title: "Employee",
            text:["ID: Number","Login: Text","Password: Text"],
            fill: "#CEEFE1",
            stroke: "#0AB169",
            strokeWidth: 2,

            x: 540, y: 220, width: 140, height: 160,
        },
        {
            id: "s4",
            type: "template",
            title: "Project",
            text:["ID: Number","Access[]: Employee ID","Task[]: Task ID","Name: Text"],
            fill: "#CEEFE1",
            stroke: "#0AB169",
            strokeWidth: 2,

            x: 120, y: 220, width: 180, height: 160,
        },
        // connectors
        {
            type: "line",
            stroke: "#0AB169",
        connectType: "elbow",
            from: "s1",
            to: "s2",
            fromSide: "bottom",
            toSide: "top"
        },
        {
            type: "line",
            stroke: "#0AB169",
            connectType: "elbow",
            from: "s1",
            to: "s4",
            fromSide: "left",
            toSide: "top"
        },
        {
            type: "line",
            stroke: "#0AB169",
            connectType: "elbow",
            from: "s1",
            to: "s3",
            fromSide: "right",
            toSide: "top"
         },
     // text
    {
            type: "text",
            fontColor: "rgba(0,0,0,0.70)",
            lineHeight: "14",
            fontSize: "14",
            text: "Assigns",
            textAlign: "center"
         },
    {
            type: "text",
            fontColor: "rgba(0,0,0,0.70)",
            lineHeight: "14",
            fontSize: "14",
            text: "Manages",
            textAlign: "center"
         },
    {
            type: "text",
            fontColor: "rgba(0,0,0,0.70)",
            lineHeight: "14",
            fontSize: "14",
            text: "Coordinates",
            textAlign: "center"
         },
    ];

diagram.data.parse(fullHtmlData);

At this step, we prepare an entire dataset for shapes, connectors, and text elements to be loaded into our JavaScript UML class diagram. We specify the data for each shape in the JSON format. We use the parse method to load the prepared data.

6. Style particular elements of the UML class diagram:

<style>
    .template {
        height:100%;
    border-radius: 10px;
    overflow: hidden;
    }
    .template h3 {
    text-align: center;
    height: 40px;
    line-height: 40px;
    }
    .template ul {
    padding: 8px 5px 5px 5px;
    }
    .template li {
    text-align: left;
    list-style-type: circle;
    margin: 5px 0 0 20px;
    white-space: nowrap;
    }
</style>

As a final touch, we can enhance the look and feel of our JS UML class diagram by specifying style attributes for its elements. We can define the border-radius, text-align, line-height, and other settings of UML class shapes.

Following these six steps, you have a simple JavaScript UML class diagram ready.

Final words

DHTMLX Diagram library enables developers to create JavaScript UML class diagrams as well as a wide variety of other diagram types in a few lines of code. You can easily add any custom shapes via HTML templates and specify the default configuration of shapes with just one property. DHTMLX offers a 30-day free trial version to evaluate the library and try it out in your projects.

Related materials:

The post How to Create a JavaScript UML Class Diagram with DHTMLX appeared first on DHTMLX Blog.

Maintenance release: Gantt 7.0.5, Suite 6.5.2, Scheduler 5.3.9, Diagram 3.0.2, Pivot 1.4.3

$
0
0

The time has come for a midsummer review of maintenance releases for DHTMLX JavaScript libraries. Recently, our vigorous development team has managed not only to roll out big releases and updates of our JavaScript UI widget library and Diagramming component but also has delivered numerous useful fixes for our other main products. Check out the details below.

DHTMLX Gantt 7.0.3 – 7.0.5

7.0.3 (May 16, 2020)

  • (Fixed) regression in the setWorkTime method which caused a script error when the working time was set for a specific day
  • (Fixed) the incorrect work of the Keyboard Navigation extension when Gantt is used inside a SalesForce Lightning Web Component

7.0.4 (June 4, 2020)

  • (Removed) the 10000px limit on the gantt size in the autosize mode, which should allow printing larger charts
  • (Updated) Drag and drop now finishes when the user releases the mouse button over any part of the document body rather than over the gantt container only
  • Portuguese locale was updated
  • (Fixed) the return type of gantt.columnIndexByDate in type definitions
  • (Fixed) script errors that were fired when the Gantt instance was destroyed during drag and drop
  • (Fixed) the incorrect calculation of end_date/duration when duration_unit is set to “minute” and the last worktime interval finishes after 23:00
  • (Fixed) the issue which caused groups of the grouping extension to expand whenever the user modified any task
  • (Fixed) the issue which caused the second parameter of dataProcessor.setTransactionMode to be ignored if an object was passed into the first parameter
  • (Fixed) the issue which caused the active inline editor to disappear after repaint of Gantt
  • (Fixed) the issue with the static_background extension which caused mouse click on empty cells to be interpreted as a click on task elements
  • (Updated) Gantt now dynamically repaints links between split tasks during drag and drop
  • (Fixed) the script error which was thrown from gantt.addTask in the node.js package
  • (Fixed) the script error which was thrown from gantt.destructor in the node.js package

7.0.5 (June 19, 2020)

  • (Updated) Performance improvements for work time calculation when the duration_unit config is set to “hour”
  • (Updated) Performance improvements for work time calculation when the duration_unit config is set to “minute”
  • (Updated) the ability to specify working calendars in the configuration object of Gantt.getGanttInstance is added

Learn more in the documentation >

DHTMLX Suite 6.4.4 – 6.5.2

6.4.4 (May 19, 2020)

  • (Fixed) the behavior of Layout inside a resizable window
  • (Fixed) the behavior of charts placed into a cell of Tabbar in IE
  • (Fixed) issue with the AfterShow event of Layout not being called
  • (Fixed) the incorrect work of the destructor() method when combo filters are not specified in Grid
  • (Fixed) the incorrect work of the change event when the multiselection property is enabled in Combobox
  • (Fixed) the incorrect work of the change event while calling the clear() method in ColorPicker
  • (Fixed) issue with the getValue() method of Form
  • (Fixed) the incorrect work of the change event while calling the clear() method for Form controls (Input, Textarea, Checkbox, RadioGroup, Select, DatePicker, TimePicker, ColorPicker, Combo)
  • (Fixed) the incorrect work of the Combo control of Form while calling the getValue() method
  • (Fixed) issue with the change event of Form
  • (Fixed) validation for the Input control of Form
  • (Fixed) rendering of custom HTML content in Window
  • (Fixed) priority of the modal window while calling more than one window

6.5.1 (June 16, 2020)

  • (Fixed) the issue with npm codebase build

6.5.2 (July 14, 2020)

  • (Fixed) types in d.ts
  • (Fixed) the issue with the editCell method in Grid
  • (Fixed) the issue with the removeRowCss method in Grid
  • (Fixed) the issue with Grid while using together with Window
  • (Fixed) the issue with “email” validation rule of input in Form
  • (Improved) editing mode when drag and drop is enabled in Tree
  • (Fixed) the issue with rendering nested levels of TreeGrid items

Learn more in the documentation >

DHTMLX Diagram 3.0.1 – 3.0.2

3.0.1 (May 29, 2020)

  • (Fixed) issue with the autoPlace() method
  • (Fixed) issue with PNG/PDF export modules

3.0.2 (July 14, 2020)

  • (Fixed) the issue with import data from JSON to Org Chart Editor
  • (Fixed) the incorrect work of the addShape() method while configuring Right Panel
  • (Improved) behavior of historyManager in Editors (Undo/Redo buttons)

Learn more in the documentation >

DHTMLX Scheduler 5.3.8 – 5.3.9

5.3.8 (May 14, 2020)

  • (Fixed) the incorrect height of the modal overlay of the Lightbox
  • (Fixed) the incorrect sizes of the scheduler when the scheduler is initialized inside Bootstrap modals
  • (Updated) Scheduler now automatically tracks the container resize and adjusts its own sizes accordingly
  • (Updated) Add Mini Calendar control for the header config

5.3.9 (June 4, 2020)

  • (Fixed) the incorrect display of a scrollable timeline after scrolling it down and dragging and dropping the last row
  • (Fixed) the incorrect display of events which happened after switching between two scrollable timelines
  • (Fixed) script error that fired when a timeline was scrolled on touch devices
  • (Fixed) the incorrect Content-Type of POST/PUT/DELETE requests sent by dataProcessor when custom headers are specified
  • (Added) the timeline_row_class template for CSS class of a timeline row

Learn more in the documentation >

DHTMLX Pivot 1.4.3

1.4.3 (May 27, 2020)

  • (Fixed) the behavior of dragging and dropping in the data field which caused the position of selected fields not being changed
  • (Updated) the footer content now influences on the alignment of the width of Grid columns
  • (Fixed) mathematical calculations of fractional numbers in the footer of a grid
  • (Fixed) the behavior of filters of fields when there are empty values in a data set
  • (Fixed) the possibility to localize operations and dates
  • (Fixed) the issue with rendering HTML content in cells of Grid

Learn more in the documentation >

Download the latest versions of our libraries and test them free of charge for 30 days:

Current clients may find the updated packages in their Client’s Area.
Enjoy sunny summer days and don’t forget to share with us your opinion on the latest updates!

The post Maintenance release: Gantt 7.0.5, Suite 6.5.2, Scheduler 5.3.9, Diagram 3.0.2, Pivot 1.4.3 appeared first on DHTMLX Blog.

How to Create a Basic Gantt Chart with Salesforce Lightning [Video Guide]

$
0
0
Introduction

If you’re developing a project management application based on the Salesforce Lightning platform, you probably use the Lightning Web Components (LWC) that significantly simplify and accelerate the process of building responsive applications for any device. But any modern project management app can hardly be good enough for achieving complex business objectives without a Gantt chart functionality. And the good news is that you can easily integrate the DHTMLX Gantt chart with Salesforce Lightning components into your app.

In this post, we’d like to share with you a code example on GitHub and a detailed video guide on how to use our Gantt component with Salesforce in your project.

Why Use Lightning Web Components for Creating Your Salesforce App?

Salesforce has become widely recognized in the software industry as a global leader in cloud-based CRM technologies, but the company is also known for its innovative solutions for front-end development such as Lightning Web Components (LWC). This modern JavaScript programming model helps to create high-performant Salesforce apps that run on modern web browsers using the latest web/W3C standards and newest JavaScript features.

In essence, LWCs are custom elements built using HTML and ES6+ standards. Introduced at the end of 2018 as a more advanced alternative to the older model named Aura components, LWC has become a great possibility for millions of JS developers around the globe to write code on the Lightning Platform in a much easier way. The thing is that developers don’t need to learn any new frameworks to work with LWC but can use standard tools (HTML, CSS, JS), thus the whole development process becomes much simpler and faster.

Using DHTMLX Gantt for Implementation of Gantt Chart Functionality

DHTMLX Gantt is a comprehensive JavaScript library that enables developers to build Gantt charts of any complexity level complemented with numerous useful features (critical path, resource management, auto-scheduling, etc.) and make use of advanced customization capabilities. But most importantly, our Gantt component can be smoothly and securely integrated with Salesforce via the LockerService mechanism without any compatibility issues.

Video Guide to DHTMLX Gantt Integration with LWC

When it comes to the integration of our Gantt library, developers have nothing to worry about, as our video guide makes the whole process comprehensible.

Before starting it is necessary to meet two preconditions: enable the Developer Hub that is needed for creating and managing scratch orgs and install the Salesforce command-line interface named Salesforce CLI for convenient coding. After that, just follow the instructions, and very soon you will get the desired result.

Want to try DHTMLX Gantt for building your own Salesforce app? Visit our GitHub repository where you can find the full source code of our Gantt component with Salesforce and follow the steps of our video guide.

Related Materials:

The post How to Create a Basic Gantt Chart with Salesforce Lightning [Video Guide] appeared first on DHTMLX Blog.

Announcing DHTMLX Code Snippet Tool

$
0
0

Our development team continues to expand the portfolio of developer helping tools that contribute to the increase of development productivity and ensure greater convenience in working with DHTMLX products. This time we are happy to announce a new code snippet tool designed as an effective and faster way to build interactive samples of our components and share them.
In this post, we will consider the main abilities of the code snippet tool and see how they can benefit web developers.

Intuitive user interface

DHTMLX Code Snippet
The first thing that catches your eye after opening the snippet tool is its well-structured and intuitive user interface. It consists of three/four main parts: two windows for JavaScript and HTML code on the left part, review window on the right part, and a handy toolbar on the top. Thus, web developers can easily play around with the code on the left side and see how it will affect the look and feel of the component on the right side.
Moreover, our team included two themes (light and dark) to make the UI more aesthetically pleasing.

DHTMLX Code Snippe - Dark

Switching between library versions

This useful feature available via the dropdown menu at the top of the window for JavaScript code allows developers to work with different versions of DHTMLX products. Using this functionality developers can compare the appearance and behavior of the selected component under newer and older versions of our libraries.

Snippet searching options

The code snippet tool comes with several search options to help developers find the necessary component in no time. On the right side of the toolbar, you can see a standard search field where it is possible to enter the name of the needed component of function or select the necessary element/item manually from the drop-down list.
DHTMLX Code Snippet - Search
In addition, you can also navigate through snippets using tags. Compared to simple searching, this method allows you to get more accurate search results containing only your tag. For instance, if you need to find samples only on the Grid component, you can use the tag #grid and you won’t see any unnecessary components (such as TreeGrid) in search results.

Saving and sharing code snippets

The key feature of our new tool is the ability to save snippets after introducing changes into their code. Saved snippets receive unique URLs and you can share them with others. This feature can be very helpful to solve any kind of technical issues with DHTMLX products. Just make a sample illustrating the problem, save it, send the link to our support team, and your problem will be solved more quickly and efficiently. Moreover, this ability also contributes to more productive collaboration within the project team, as developers can easily share their coding examples with colleagues and improve code quality. It is possible not only to edit and save existing snippets but also to create new samples from scratch and save them as well. Web developers can also make use of the following useful features:

  • autocomplete suggestions
  • automatic source code formatting called with the key combination Shift + Alt + F for Win (⇧Shift + ⌥Option + F for Mac)
  • comment / uncomment selection code invoked by pressing Ctrl + / for Win (⌘Command + / for Mac)

All in all, the code snippet tool allows web developers to get a deeper insight into each component, examine and estimate code cleanliness and readability. It ensures a shorter learning curve for DHTMLX products and speeds up the whole development process.

Try our new code snippet tool and estimate its abilities in practice!

The post Announcing DHTMLX Code Snippet Tool appeared first on DHTMLX Blog.

5 Ways on How to Improve Your API’s Performance [Guest Post]

$
0
0

One thing most people forget about APIs is that they slow down over time. When it’s brand-new and fresh into its integration, the new service may be very fast and responsive. But as the months pass and new complexities are introduced into the system, the API becomes more prone to delay and error. In some cases, a single user action can bog the service down and cause an expensive standstill. So the question is: what can developers do to overcome the challenge of slow APIs?

The answer lies in three things: forethought, preparation, and careful choices in the API design strategy. In order to improve the performance of your API, you must be well aware of what slows them down — and be responsive in your design and troubleshooting. Here are five starting points for bolstering your API’s performance and making sure your users get the most out of the service.

Think Ahead about the Things That Slow APIs Down

The first thing you should do is accept that API slowdowns are inevitable. You can also attribute the API’s laggard performance to particular things. Some factors that contribute to slowdowns are the following:

  • What type of data the API returns
  • How much data the API returns
  • The rate of API calls
  • How many filters and selectors the user action goes through

Mapping out the common causes of slowdowns and thinking of common scenarios will help you implement timely responses. So make sure to keep these factors in mind.

Build Your API for High Performance on a Comprehensive Design Tool

Another favor you should be doing for your API’s performance is doing all the necessary adjustments on a reliable API Design, Planning & Modeling Tool. True, there’s no way to make a bulletproof API. But you’ll have the closest thing to it if you plan, design, and test the product on a comprehensive toolset. Being able to prototype your API on a quality hosted tool may help you think ahead about potential problems.

Use a More Lightweight Format for Storing and Transporting API Data

The third strategy you can employ to improve your API’s performance is to switch to a better format for data storage and transport. If you need advice on which format to use, note that developers recommend choosing JSON over XML. The former is more lightweight, requires a lighter payload, and consumes less bandwidth. Opting for a format like JSON could result in faster performance for the API.

Take Advantage of Caches

If you haven’t made the most out of caches, now’s the time to do so. Caches allow APIs to serve responses without the system having to recalculate them all over again. Examples of caches you can use for your API to improve its performance are HTTP caches and application caches. The advantages of doing so include less load on backend, lower latency, and faster serving of data to your users.

Make Good Use of Asynchronous Methods

In synchronous programming, when a request comes in, everything halts until it gets back the expected return. But what if the request takes a long time to complete, and the rest of the application is unresponsive until the method returns? You can imagine how frustrated your user will be as a result. Thus, in certain cases, it would be good to explore asynchronous methods for your API. If you deploy asynchronous methods correctly, you’ll increase the number of concurrent requests that your API can take without waiting for that loop to close. That, in turn, increases the API’s throughput, or how much work it gets done in a unit of time.

When your API is fast and appears to get a lot of work done, you leave a good impression on your end-user. Make sure it lasts by considering these five tips. Use a ground-up approach to designing, testing, and implementing your API—that’s what will make the improvements easy to execute.

The post 5 Ways on How to Improve Your API’s Performance [Guest Post] appeared first on DHTMLX Blog.


How to create a JavaScript network diagram with DHTMLX

$
0
0

We continue the series of blog posts on how to create popular types of diagrams available in the DHTMLX Diagram library. This time, we will provide you with a detailed guide on how to build a JavaScript network diagram using our diagramming component. Equip yourself with a DHTMLX Diagram trial version and follow the instructions below.

What is a network diagram

A network diagram is a type of diagram that helps to visualize the architecture of computer or telecommunication systems of any complexity level (from basic home networks to complex MAN networks or cloud-based storage systems). It depicts various components such as routers, servers, hubs, etc. that shape into a network using special symbols and explains relationships between them.

Network diagrams differ in two main aspects: network type and network topology, or the positioning of its elements.

Network diagrams are commonly divided into two main types:

  • Physical network diagrams that represent the physical layout of the network.
  • Logical network diagrams that depict how data is transmitted via the network.

When talking about possible arrangement variations for network diagrams, we can point out the following topology options:

  • Bus topology
  • Star topology
  • Ring topology
  • Mesh topology

Network diagrams are extensively used in network architecture design. For example, this type of diagram can be helpful in planning the arrangement of networks, determining updates for existing networks or eliminating redundancies, detecting bottlenecks and vulnerabilities, be used as a part of network documentation, etc.

Moreover, network diagrams have also gained popularity in project management. Utilizing this type of diagram, project managers can vividly present the workflow of different project activities, monitor the project progress, perform time estimates for the project, and much more.

Example of a JavaScript network diagram

JS network diagram

Let us consider the example of a JavaScript network diagram built with the use of our Diagram library.

The example above depicts the architecture of the remote presence software system. This technology creates a virtual presence of a remote expert to consult specialists in any location.

This system includes four main components:

  • signal server that provides proper signal transmission (video and audio)
  • client-side app on a device
  • web UI on a PC for an expert
  • process management system/storage/wiki-systems, etc.
How to create a JavaScript network diagram with DHTMLX

Now let us proceed with concrete steps for creating a network diagram utilizing our Diagramming component.

1. Initializing DHTMLX Diagram library:

<!DOCTYPE html>
<html>
<head>
  <script type="text/javascript" src="codebase/diagram.js"></script>    
  <link rel="stylesheet" href="codebase/diagram.css">
</head>
<body>
  <div id="diagram"></div>
  <script>
    const diagram = new dhx.Diagram("diagram", {
      lineGap: 20
    });
  </script>
</body>
</html>

First of all, it is necessary to add JS and CSS source files and a container, where your diagram will be placed. The next move is to apply the dhx.Diagram constructor that will help to perform the initialization of your diagram. This function takes two parameters: container originated at the previous step and object with configuration properties.

2. Specifying the default configuration of shapes via the defaults config:

const defaults = {
    width: 160,
    height: 160,
    img: "../common/img/network_image/desktop.svg",
    text: "Network Card",
    ip: "138.68.41.78",
    preview: {
        scale: 0.8
    }
};

When it comes to setting up the configuration properties of shapes for your network diagram, you can do it much faster and easier using the defaults config. Our example includes eleven shapes with a similar size (160×160). Each shape has a text, naming a particular component of the network, image, and string of numbers for its IP address.

3. Creating a template for custom shapes of the network diagram:

const template = config => (`
    <section class='template'>
        <img src='${config.img}' alt='${config.text}'></img>
        <span>${config.text}</span>
        <span>${config.ip}</span>
    </section>
`);

Then, you have to create a new HTML template to make custom shapes for your diagram. In this example, we employ the ES6+ format (ES5 is applicable as well) to set up the template for your custom shapes. By putting to use the template, you can define all necessary content for the shape: an image that shows a specific component of the diagram and alt attribute that provides an alternate text for an image (if the image cannot be displayed), name of the component, and its IP address.

4. Adding shapes to the network diagram:

diagram.addShape("networkCard", {
    template,
    defaults,
});

The next move is to add custom shapes to the diagram. For this purpose, we utilize the addShape method. This method serves to promptly add different shapes generated by employing the templates.

5. Preparing and parsing data into the diagram:

diagram.data.parse(networkDiagram);

To populate your diagram with prepared data, it is necessary to apply the parse method.

6. Styling specific elements of the network diagram:

<style>
    .template {
        display: flex;
        align-items: center;
        justify-content: center;
        flex-direction: column;
        background: #F7F7F7;
        width: 100%;
        height: 100%;
        border: 1px solid #DFDFDF;
        overflow: hidden;
    }
    .template span {
        font-weight: 300;
        line-height: 20px;
        overflow: hidden;
        text-overflow: ellipsis;
        white-space: nowrap;
        width: 100%;
        text-align: center;
    }
    .template span:not(:last-child) {
        font-weight: 500;
        margin-top: 16px;
    }
    .template img {
        width: 64px;
        height: 64px;
        pointer-events: none;
        border-radius: 50%;
    }
</style>

As the last step, you can make your diagram more visually appealing by setting up style attributes for its elements be means of CSS. We can specify the color characteristics for background and border of the shape, align items and textual data, size of the image and other characteristics of shapes utilized in the network diagram.

That’s how you can quickly build a network diagram using the abilities of our diagramming component. As a bonus, you can also examine a complete sample of this network diagram and modify it on the fly via our new DHTMLX code snippet tool.

Conclusion

DHTMLX Diagram library makes it possible for web developers to generate JS network diagrams and other popular types of diagrams for visualizing data of any complexity with minimal coding effort. You can set the default configuration for all shapes using just one property, create various custom shapes, and style all shapes and their elements according to your liking. We encourage you to leverage a 30-day tryout version of our library and test its capabilities in your projects.

Related Materials:

The post How to create a JavaScript network diagram with DHTMLX appeared first on DHTMLX Blog.

Examples of DHTMLX JavaScript Libraries Customization by XB Software

$
0
0

During the last ten years, DHTMLX products have gained popularity in the world of web development thanks to the availability of highly-demanded functionalities, comprehensive API, smooth integration with other technologies, and especially for their extensive customization possibilities.

Our JavaScript libraries frequently become core components of enterprise web apps of any complexity. Such software solutions are widely-used by world-renowned companies like NASA, Apple, Google, etc. as well as by many start-ups.

DHTMLX customers frequently outsource their business needs to our custom software development company named XB Software. Here they can rely on the experienced team of developers who have enough knowledge and skills to perform DHTMLX customization and deployment tasks in strict accordance with the specified requirements.

To back up our words with some actual evidence, we will consider four real cases of how our popular DHTMLX Gantt and Scheduler components can be customized and integrated into business apps.

DHTMLX in Delivery Management System

The customer working in the sphere of logistics has requested the development of a delivery management software. The solution had to satisfy the following requirements:

  • ensure quality data exchange between different branches of the company (from dispatchers to drivers)
  • optimize delivery processes and reduce costs
  • new functionality must become an addition to the existing ERP system utilized by the customer’s company.

The development team has designed an integrated delivery management module that completely satisfied the customer’s expectations. It was largely achieved due to a variety of views and features available in DHTMLX Scheduler that became a centerpiece of the whole application. Since our lightweight Scheduler library is compatible with popular JavaScript Frameworks and server-side technologies, it was not a problem to integrate it into the module and ensure smooth synchronization and data exchange with the existing customer’s system.

delivery-management-system-main

Using our JavaScript event calendar component, developers put into effect all delivery scheduling features. The powerful JavaScript API enabled developers to set up custom views (order screen and truck screen). These views allow dispatchers to keep track of all current orders and get the necessary info on trucks and drivers of the company using various sorting criteria. Thanks to the integration with mapbox, it has become much easier to keep in check the delivery status and facilitate the planning of delivery routes via the map view.

delivery-management-system-2

As our Scheduler supports various touch screen devices, the dev team has been able to provide both desktop and mobile versions of the application. The mobile version for warehouse workers and drivers contributed to enhanced staff mobility and better access to the relevant information, allowing to use all JavaScript schedule features on touch screens, including drag-and-drop, scrolling, and editing.

As a result, the product created by XB Software with the help of the DHTMLX Scheduler has helped the logistics company to optimize delivery processes and boost its work efficiency.

DHTMLX in Project Management App for Construction Industry

Managing a construction project can be very complex and time-consuming, as it commonly includes the necessity to keep track of a large list of activities, effectively handle challenging tasks, assign available resources, and monitor the overall progress of one or even several projects at once. One construction company experienced similar difficulties and reached out to XB Software specialists with the necessity to develop the online management application based on the DHTMLX products.

When working on this project, the development team has relied entirely on our Gantt chart and Scheduler components as well as on React framework, and it paid off. Using DHTMLX Gantt, developers have enriched the application with a user-friendly Gantt chart functionality. It helps to visualize a particular project along a given timeline, thereby providing necessary data on tasks with their start and end dates, workforce involved, project status at any given moment.

If the project manager wants to see all tasks assigned to a specific person, he/she can also make use of the resource calendar implemented with the help of DHTMLX Scheduler.
project-management-solution-for-construction-industry-1
Users can create new projects from scratch, employ predefined templates. When working with multiple projects, users can easily switch between them.

When it comes to project tasks, it is possible to easily create and manage different types of tasks (regular, project, milestone) using drag-n-drop functionality. Users can define dependencies between tasks, split complex tasks into more manageable pieces, change the percent of task completion and its duration on the fly.
project-management-solution-for-construction-industry-2
DHTMLX Gantt also provided more advanced project management features. For instance, enhanced resource management capabilities allow users to analyze the workload of each worker and allocate resources to tasks more efficiently utilizing the resource usage diagram. In addition, project managers can apply baselines, deadlines, and other useful elements.

Thus, this application allows managers of the construction company not only to be more effective in tracking current projects and distributing tasks among employees but also to define a clear timeframe for a particular project and plan ahead.

DHTMLX in Truck Booking and Monitoring System

Nowadays, it is next to impossible to become successful in any field without the use of the latest software standards and technologies. For instance, one large logistics company specialized in truck renting had a hard time trying to improve its fleet management efficiency, cut operating costs, and increase overall business performance before the adoption of a custom truck booking and monitoring system with GPS tracking support developed by our outsourcing company.
gps-fleet-management-truck-booking-system-main
Taking advantage of the highly customizable DHTMLX Scheduler, developers created a robust and user-friendly system with truck booking features. It has been smoothly integrated with Node.js applied on the server-side via REST API. Our JavaScript event calendar component made it much easier to book a truck online and to keep track of the vehicle with their cargo in real-time.
gps-fleet-management-truck-booking-system-2
The intuitive user interface based on Material Design, sorting and searching options allow users to easily navigate through tons of events and find all necessary info in a couple of clicks. The possibility to look through the list of available trucks and their locations via the roadmap view helps to quickly find the most appropriate variant. Cross-browser and cross-platform support allows users to conveniently use the application from different browsers and devices without rendering issues.

All in all, this DHTMLX-backed software solution helped the logistics company to raise service standards, optimize its costs, and increase customer satisfaction.

DHTMLX in Car Service Scheduling and Warehouse Management System

The maintenance and repair of vehicles is an extremely competitive industry, thus owners of repair shops have to invest not only into car repair equipment, but also into software solutions that help to address the following needs: service scheduling, warehouse management, and company performance evaluation. Seems like each of the above-mentioned tasks may require a separate software solution. But the XB software team managed to develop an all-in-one solution built upon DHTMLX Scheduler that fully complies with the request of one big car service company.
warehouse-management-system-main
The flexible scheduling system implemented with the help of our Scheduler library provides a convenient way of making appointments via an intuitive online calendar. If clients need to see the schedule of a specific specialist on a particular day, they can find this info using different filtering options. This software solution also allows technicians of the company to get a brief description of the client’s problem and to see the availability of required car parts in stock for each particular case using custom tooltips supported by our library.
warehouse-management-system-2

Moreover, it is possible to schedule the purchase and delivery of missing components. Thereby, DHTMLX Scheduler improves warehouse management and facilitates the automation of the overall workflow. Besides, the system enables the company’s management to gather staff statistics and estimate the efficiency of each employee.

Ultimately, the company has received a comprehensive software system reinforced by DHTMLX Scheduler capabilities that significantly simplify interactions with customers, enhances warehouse management, and assesses the productivity of the company’s staff.

Final thoughts

The review of these four cases shows that DHTMLX JavaScript libraries can become an effective and flexible tool for the development of enterprise software solutions. These JavaScript components help to simplify and optimize dozens of business processes in projects including task managing and event planning.

If you need help in efficient customization and implementation of DHTMLX products in your project or create a custom-made application from scratch using our JS components, leave the description of your project right here and the XB Software team will work out for you the best possible solution.

The post Examples of DHTMLX JavaScript Libraries Customization by XB Software appeared first on DHTMLX Blog.

Exporting Methods for DHTMLX Gantt. Preview of Export Module Update

$
0
0

Exporting is a highly-demanded addition for any JavaScript library intended for project management applications, and our Gantt component also supports this feature.

Project managers frequently convert Gantt charts into PDF, PNG, Excel, iCal, MS Project, or Oracle’s Primavera to handle their projects more efficiently. For example, charts exported to PDF/PNG can be printed or sent by email. All these formats are currently supported by DHTMLX Gantt and users can download their Gantt chart project via our online service or a local module. Our development team always works on ways to improve the current exporting functionality and add new capabilities.

In this blog post, we will take a closer look at the available exporting methods from DHTMLX Gantt and shed some light on the upcoming update for the export module that will have a positive impact on exporting to PDF/PNG formats.

Exporting options for DHTMLX Gantt

As mentioned above, there are two ways to export instances of your Gantt charts into available formats but there are some peculiarities that should be taken into account by users when it comes to using the proposed methods. Let us delve into details.

Online Service
By default, it is possible to export Gantt charts to the required format using our free online service. When selecting this option, users have to send their Gantt data to our server. Users should not worry about security issues, as we do not convey their data to any third parties and all temporary files are removed automatically after the export completion. Charts exported via the online service can contain a DHTMLX watermark if users employ an open-source version of our Gantt component. Under the active PRO licenses, it is possible to convert Gantt charts into needed formats without the watermark.

It is also important to point out that the maximum request size of Gantt charts that can be exported to all available formats via the online service is 10 MB. But for MS Project the endpoint can be expanded to 40 MB.

Export Module
If users want to export even more safely and reliably, they can make use of a local export module. DHTMLX offers 2 export modules:

  1. When it is necessary to export the data to PDF, PNG, Excel, and iCal formats, the module can be installed on any platform as a Node.js application or as a Docker image.
  2. If Gantt chart projects have to be exported to MS Project and Primavera formats, then the module is presented as an application developed from ASP.NET that operates on Windows and IIS. This module is supplied as the source code and can be deployed on the user’s server.

Thus, the module becomes a more secure and reliable way of exporting Gantt charts, as users don’t have to send data to external servers and need no internet connection. Using the module, users don’t have to be concerned about any data leakages and can export their projects without watermarks.
image1
Here is the example of exporting a Gantt chart that contains numerous project tasks and dependencies between them to PDF format.

Under the Ultimate license (and the Enterprise when exporting only to PDF, PNG, Excel, iCal), the export module comes free of charge, while for other licensing options the module can be acquired separately. Before using this option, we recommend you to become familiar with system requirements and terms of use.

Upcoming Export Module Update (PhantomJS vs Electron)

For quite a while, our export module has been relying on PhantomJS as a solution for rendering charts on the page and saving them to PDF/PNG. However, this technology has already become outdated.
When using the PDF/PNG export module, the maximum exporting capability is measured by the number of tasks and year scale for PDF and the chart size for PNG. Currently, PhantomJS allows exporting charts with no more than 1000 tasks and a 10-year scale for PDF, and 16384×16384 px (or 300 tasks, 1-year) for PNG.

Therefore, our development team is currently working on a major update for the export module that implies switching from PhantomJS to Electron. Using the Electron framework as a new rendering engine for our export module will provide the following advantages:

  • Exporting large charts

During a test stage of the module update, we’ve successfully exported Gantt charts to PDF with thousands of tasks and multiple years of time scale with day columns. The execution time was under 20 seconds. Technically, if you install the export service locally, you should be able to export much larger charts to PDF, but the execution time will increase with the size of the chart. Speaking about PNG, the updated module will allow users to export sizeable charts by chunks, which can be later recombined (maximum chunk size will be around 10000*10000 px).

  • Multipage export

The update will also enable users to export the data on several pages by cutting charts into several pages.

  • Page orientation

If users indicate the page format during the export, they will be able to specify its orientation.

  • Improved support of CSS and HTML-elements

PhantomJS does not support many modern CSS styles and HTML elements. The adoption of Electron should solve this problem and fix some other bugs related to exporting charts built with DHTMLX Gantt.

In this article, we have reviewed current exporting capabilities for DHTMLX Gantt and got familiar with the new features of the export module that will be included in the upcoming update. If you utilize the export module under the active license, contact our support team for obtaining a candidate version of the new module before its official release.

Related Materials:

The post Exporting Methods for DHTMLX Gantt. Preview of Export Module Update appeared first on DHTMLX Blog.

Customer Spotlight: DHTMLX Gantt in AugmentedCISO

$
0
0

It is hard to argue that reliable protection of information assets and technologies plays an important role in the daily activities of any company. That’s what EXCUBE, a French company specialized in cybersecurity, actually does, ensuring a trouble-free presence of its customers on the web. And we are very pleased to know that our Gantt component has become an integral part of the AugmentedCISO project.

In this article, we show how the EXCUBE team uses the DHTMLX Gantt library to achieve a successful visual representation of recurring tasks within its product AugmentedCISO.

Presentation of AugmentedCISO

AugmentedCISO is an innovative solution designed by CISO, for CISO (Chief Information Security Officer). More than a piece of software, it constitutes the digital skeleton of CISO.

It is the first solution dedicated to CISO, that will help and guide them in the monitoring of cybersecurity. It is a SaaS (Software as a Service) product, adaptable and collaborative.

The goal is simple and ambitious: accompany the CISO in its cybersecurity monitoring tasks. With AugmentedCISO, the CISO will improve:

  • The efficiency of its activities by a daily gain of time
  • The visibility on the security posture and the evolution of cyber-risks
  • The consistency between strategy and operations of security

The main innovations of AugmentedCISO are the following:

  • The product is entirely dedicated to CISO: ergonomic and adapted to stakes of cybersecurity
  • Security measures have been modeled so that policies, measures, and indicators are tightly coupled
  • Complex organizations can be handled with perimeters and groupings, which allows the CISO to have a clear view of cybersecurity by entity, subsidiary, etc.

Here are some use cases of AugmentedCISO:

  • Evaluate security measures efficiency with strategic and operation dashboards and runbooks
  • Evaluate the security posture of the company
  • Measure the impact of ongoing projects on risks
  • Monitor and control complex security programs and visualize their impacts on risks and conformity
  • Record and track tasks (recurring or not) relating to cybersecurity management
Runbooks

In this article, we will have a closer look at one feature of AugmentedCISO — runbooks.
runbook1
runbook2

A runbook is a set of tasks that must be done and proofed at a given periodicity (weekly, monthly, quarterly, etc.) to ensure that security measures are efficient. The challenge is to build an efficient visual representation of the tasks, each task having an owner, many “proofs” with state (done, not done) and due date. The view’s objective is to allow the CISO to overview the tasks and quickly see what needs to be addressed, but for higher level management, we also need summaries to be shown (i.e. the number of tasks in a certain amount of time).
runbook3
runbook4
runbook5

Furthermore, the CISO needs to have an overview of the workload induced by the tasks, by user/team, over time.
runbook_workload
We already use the DHTMLX Gantt library to show projects and non-recurring tasks in another part of AugmentedCISO, and given the large possibilities offered by the library, we decided to use it to achieve this specific goal.

For the main part of the view (showing the tasks and their proofs), we use a custom layout, and for each task we place the required number of badges (one per proof), coloured according to its state and placed in time according to its due date. Depending on the selected time scale, there can be multiple proofs in a time period, in this case we choose to display the number of proofs, coloured with the colour of the worst task in terms of status (not realized and late, not realized, not done, done, in the future).

A click on a proof allows the user to edit it: mark as done/undone, delete the proof, change comment/assignee and upload files. For the summary part (two lines at the bottom), we use “resource” type of layers, and we compute the number of tasks as well as the sum of their workload.

The workload view also uses a “resource” type of layers, to display the sum of workloads for each user/time, for each time period.

That’s how key features of DHTMLX Gantt help security officers to manage recurring tasks and estimate the workload.

Many thanks to the AugmentedCISO team for choosing our HTML5 Gantt chart for their platform and providing this amazing story. If DHTMLX products helped you in achieving your business goals, share with us your success story right here, and get some goodies from our team.

The post Customer Spotlight: DHTMLX Gantt in AugmentedCISO appeared first on DHTMLX Blog.

Maintenance release: Gantt 7.0.9, Suite 6.5.3, Pivot 1.4.4

$
0
0

It’s sad to say that summer is over, but the good news is that we’ve prepared for you a new package of updates for our products. While our development team applies finishing touches to the upcoming release of DHTMLX Gantt 7.1, users of our Gantt component can benefit from numerous fixes and improvements described below. We also delivered some enhancements in DHTMLX Suite and Pivot libraries. So, meet the first maintenance release of this autumn.

DHTMLX Gantt 7.0.6 – 7.0.9

7.0.6 (July 16, 2020)

  • (Fixed) script errors that were fired on touch devices during drag and drop
  • (Fixed) the incorrect work of the Auto Scheduling extension when types of links were defined using numeric values
  • (Updated) reduced the number of redundant repaints of the resource histogram
  • (Updated) performance improvements for the task grouping extension
  • (Fixed) the ability to scroll a resource timeline on touch devices
  • (Fixed) the incorrect work of the resource control when the ‘hide empty’ button is used
  • (Fixed) the return type of gantt.Promise in type definitions

7.0.7 (July 17, 2020)

  • (Fixed) the syntax error in type definition of gantt.Promise

7.0.8 (July 24, 2020)

  • (Fixed) some issues with touch support on Android/iOS devices
  • (Fixed) regression (appeared in v7.0.6) with link creation and gantt.isLinkAllowed method
  • (Fixed) the script error which was thrown when the ‘locale’ parameter was used in gantt.getGanttInstance
  • (Fixed) the script error that was thrown from gantt.destructor when the Keyboard Navigation and the Quick Info extensions were used

7.0.9 (August 27, 2020)

  • (Fixed) the script error on the second initialization of Gantt when custom datastores are added
  • (Fixed) the incorrect work of auto-scheduling when using with FF and SS links and when the source and target tasks use different working calendars
  • (Fixed) the incorrect calculation of working time when duration_unit is set to “minute” and the start time is set to the middle of a non-working day
  • (Fixed) touch support for Safari iPad on iPadOS v13.6
  • (Fixed) the sizes of the Lightbox modal overlay on mobile devices
  • (Fixed) the incorrect display of lightbox buttons in some browsers
  • (Fixed) support of Italian and Portuguese locales in the gantt.i18n module
  • (Fixed) the bug in the Parent control of the Lightbox which caused the incorrect work when tasks were assigned to the root level
  • (Fixed) the script error which happened when initializing a gantt inside an iframe
  • (Fixed) the incorrect work of the redo config when the undoconfig is disabled

Learn more in the documentation >

DHTMLX Suite 6.5.3

6.5.3 (September 2, 2020)

  • (Fixed) the behavior of the keyNavigation property of Grid when the grid is attached to a collapsed Layout cell
  • (Fixed) the issue with positioning of a popup relative to a Window
  • (Fixed) issues with the event system of a checkbox editor in Grid
  • (Fixed) the issue with calculation of Grid height when Grid has frozen columns
  • (Fixed) the behavior of the adjust property of Grid when some columns are hidden
  • (Updated) Mechanism of appearing of a Popup widget on a page is reworked
  • (Updated) Checking the incorrect data of the setCell method of Grid is added
  • (Fixed) issues with minimal and maximal values of scales in Chart

Learn more in the documentation >

DHTMLX Pivot 1.4.4

1.4.4 (September 2, 2020)

  • (Updated) the mechanism of appearing of Filters on a page is reworked
  • (Fixed) rendering of lists in Filters

Learn more in the documentation >

Download the latest versions of our libraries and test them free of charge for 30 days:

Current clients may find the updated packages in their Client’s Area.
We encourage you to express your thoughts on this pack of updates in the comments below and help us to make DHTMLX products even better.

The post Maintenance release: Gantt 7.0.9, Suite 6.5.3, Pivot 1.4.4 appeared first on DHTMLX Blog.

Top 10 NPM Packages of All Time [Guest Post]

$
0
0

Top NPM packages
NPM is a type of JavaScript node package. It is a default process to manage Node.js. For JavaScript developers, NPM has been a great tool. With NPM, they can share the prepared code for resolving any bugs within a particular website or app.

You must know that any NPM package is the compilation of three different components namely, a website, a Command Line Interface (CLI), and a registry.

In this article, we’ll discuss the top 10 NPM packages that can be most helpful for you.

1. Cloudinary

Cloudinary is the best choice if you’re handling images of your website. Every webpage requires some relevant images and Cloudinary can help developers in this area.

It is a cloud package with numerous features. Some of the things that you can do fast with Cloudinary include cropping an image, resizing the same image, naming the image, etc.

Cloudinary is also a major choice because it is extremely easy to use. To operate this NPM package, you won’t have to be a pro. Beginners can also operate the Cloudinary NPM package.

The presence of API makes Cloudinary easily accessible to any application of your choice. The free version of the Cloudinary is good for beginners.

2. Express

Express is one of the best NPM packages as it offers a server framework for any type of web application, be it single-page, multi-page or hybrid. For many developers, Express is the standard framework for creating web applications.

There are some advanced features of Express that make it a unique choice. These features include high performance, robust routing, negotiation for content, assistance through HTTP, high coverage, execution of applications at a faster speed, and so on.

With Express, you can publish any web applications you like, and the API of Express makes it easier. With Express, you get a proper outline of how any app is prepared from scratch. It is one of the best frameworks or NPM packages available in the market at the moment.

3. Nodist

The third name on our list is Nodist. Nodist is a great NPM package for Windows. It is a complete package where you can use different programs like Powershell, CMD, Cygwin, Git bash, and more. However, for beginners, using Nodist can be a big deal.

To get habituated with the Nodist NPM package, you may have to get an idea of how Nodist should be installed from the installer and Chocolatey. Once you read those guidelines, you can operate Nodist effectively.

The Nodist guideline is relevant for understanding more about debugging, testing, and putting different types of information into practice. Figuring out Nodist may take time, but afterward, it can work soundly for you.

4. Lodash

The fourth NPM package on our list is Lodash. This one is particularly useful if you’re working with lots of numbers, digits, arrays, etc.

People, who find JavaScript a challenging language, can also go for Lodash. The creation of complex functions is also easier with Lodash.

The best thing about Lodash is that it is available for usage in different formats and packages. That way, web developers can use this NPM package with greater flexibility.

5. Browserify

Many of us find it difficult to work with the JavaScript library regularly. With JavaScript libraries, changing templates, again and again, becomes an issue.

With Browserify, you are most likely to face lesser issues and the website building process can become much more enjoyable.

With Browserify, you can create such a codebase that is properly structured, simple to navigate, and well-organized. With Browserify, you can prepare a group of strong components that easily allocate various factors based on their applications in case of a website.

To manage everything with clarity and in an organized manner, don’t forget to use the Browserify NPM package.

6. Debug

The next name on our list is Debug. This NPM package is almost synonymous with simplicity. This NPM package, backed by Node.js, helps you in gathering all your logs in the coding process under a particular module.

As a result, toggling an output received from Debug also becomes easier.

Some of you may face issues with Debug. Mostly because there are some styling and tagging related tricks and first-timers may have difficulties in learning them.

However, these are not the most important features of this NPM package. You can learn it all eventually.

7. Grunt

Many web developers tend to avoid task runners from their coding process. However, they don’t understand that task runners are good to use and they can change your entire coding experience.

A well-organized task runner reduces the task load from your shoulder and activities like testing and task compilation become smoother.

Hence, with a good code runner, you can effectively complete your coding work without being bothered about other factors.

Grunt is one of the packages where there are several plugins and automation options available to you. With Grunt, your efforts can reduce to a large extent and you can easily shift your focus towards coding.

The best thing is that Grunt also lets you create your own plugin by keeping in mind your requirements.

You can also publish those APIs through this NPM. So, if you’re planning to try your hands on a task runner, Grunt should be your first choice.

8. Mocha

The eighth NPM package we’ll talk about is called Mocha. It is a JavaScript test framework that is popular among web-developers.

There are several rich features related to Mocha that stand out among other NPM packages in this list.

Once you conduct a Mocha testing, you’ll understand that such tests take place extremely serially and offer you high flexibility. The reporting with Mocha is also more accurate.

Any coder reading this article would agree that testing is an integral part of the coding process. Without running tests, it is not possible to identify if a programming language is working well or not.

With Mocha, testing becomes easier, and locating bugs and loopholes also becomes possible. Additionally, this package helps in identifying how the located bugs can be fixed to make a coding process much more meaningful.

With Mocha testing, a developer can make the code more appropriate for the application they are running.

9. Bower

The next NPM package on our list would be Bower. If you remember about traditional websites and their building process, you would know that in those times only HTML and CSS were essential for building a website.

An advanced website in those days would mean the application of JavaScript.

As days passed, websites became more advanced and libraries, frameworks, and several other tools were added to those websites.

However, it is becoming more and more challenging for web developers to handle all these factors on their own.

They need an NPM package like Bower, which single-handedly manages all website components including CSS, JS, HTML, and more.

Fonts and visual features of a website also fall under this NPM package. This package is also useful for regularly notifying you so that you can identify the risk and take action.

10. Async.js

Many times, JavaScript has become an annoying programming language. With Async.js, you can get rid of some unnecessary features of JavaScript. One feature that is most difficult about JavaScript is the render-blocking feature.

The render-blocking feature easily reduces the performance of your website as it decreases the speed of loading a page.

However, with an NPM package like Async.js, it is easier to avoid such features. In the presence of Async.js, working with JavaScript becomes smoother and your website’s speed also increases.

Even though Async.js was prepared for Node.js, it works perfectly with different browsers out there. The library within Async.js is extensive and there are over 20 functions that you can use.

Final Words

This was our list of the top NPM packages that coders and web developers can give a shot. We have discussed both popular as well as not-so-popular yet effective NPM packages in this list.

Before summarizing, we must tell you that don’t go by the popularity of the NPM packages. Instead, go by your personal requirements.

So, what are your thoughts on this list? Let us know in the comment section below.

About the Author

Harikrishna Kundariya is a marketer, developer, IoT, ChatBot & Blockchain savvy, designer, co-founder and director of the mobile app development company eSparkBiz Technologies. His 8+ experience enables him to provide digital solutions to new start-ups based on IoT and ChatBot.

The post Top 10 NPM Packages of All Time [Guest Post] appeared first on DHTMLX Blog.

Using Layout Algorithms to Arrange Diagram Shapes Automatically

$
0
0

Modern diagramming libraries frequently come with a special tool that helps to speed up the creation of different diagram types – a layout algorithm. This feature is intended for automatic arrangement of diagram elements. Based on specific rules, the algorithm calculates the positioning of diagram shapes and connectors and places them in such a way that even the most complex diagrams become clear and informative.

In this post, we will take a closer look at the most popular auto layout algorithm types, see how they are implemented in DHTMLX Diagram, and consider from a more technical standpoint how web developers can apply the auto layout function using our diagramming component.

Types of Automatic Layout Algorithms

Layout algorithms may vary in numerous aspects, but most commonly they differ in approaches to how shapes are interconnected i.e. what kind of connectors are used in the diagram.

Based on this attribute, layout algorithms are divided into many types, but the most popular of them are hierarchical layout and orthogonal layout.

Hierarchical Layout Algorithm

hierarchical layout algorithm by DHTMLX

Hierarchical layout in the org chart by DHTMLX

A hierarchical layout algorithm uses straight and diagonal connectors for arranging loaded data in a hierarchical order. It helps to clearly show the principal direction (or flow) within a diagram. Here shapes of the diagram are commonly positioned in hierarchically structured layers with most of the connectors oriented in the same direction (left-to-right, top-to-bottom, etc.). Thanks to a small possibility of crossings between connectors, the algorithm brings more clarity to the diagram.

The hierarchical layout algorithm is popular in the application areas where it is necessary to clearly show dependencies between diagram nodes. For instance, it is widely used for visualizing business activities (workflow diagrams, PERT charts, org charts), software engineering (activity diagrams), database modeling, electrical engineering, and other fields with a strong focus on the direction of data flow.

Orthogonal Layout Algorithm

Orthogonal Layout Algorithm

Orthogonal layout in the block diagram by DHTMLX

An orthogonal layout utilizes right-angle connectors for presenting directed or undirected graphs allowing you to quickly understand the relationships between nodes. Like the hierarchical layout, the orthogonal layout algorithm helps to minimize the chances of crossings and also ensures a lack of overlaps and as few as possible bends. Thus, diagrams, especially complex ones, become more compact and readable.

An orthogonal layout algorithm is an appropriate option for mid-sized sparse graphs. It can be applied in a database schema, system management, or software engineering. This algorithm can be frequently encountered in ER diagrams or circuit diagrams.

How to Use Layout Algorithms in DHTMLX Diagram

When utilizing DHTMLX JavaScript diagram library for data visualization, you can arrange diagram shapes automatically either in the direct mode or in the edges mode. The direct mode allows connecting diagram shapes with diagonal lines in a hierarchical structure. The edges mode engages right-angle connectors and helps you create orthogonal graphs.

In order to configure the automatic layout algorithm, web developers have two possible options:

By default, this method will implement the direct mode of linking shapes.
DHTMLX Diagram -Direct mode

Diagonal connectors in the direct mode

Optionally, you can change it to the edges mode via the mode parameter.

DHTMLX Diagram-Edges Mode

Right-angle connectors in the edges mode

If you want to place several diagrams next to each other on the grid, you can apply the graphPadding parameter that determines the interval between diagrams (200px, by default).

var diagram = new dhx.Diagram("diagram");
diagram.data.parse(data);

diagram.autoPlace({
   mode: "edges",
   graphPadding: 100
});

DHTMLX Auto Layout - Edges Mode

Auto layout in the edges mode

  • Set the same configuration parameters using the autoplacement property
var diagram = new dhx.Diagram("container", {
    autoplacement: {
        mode: "edges",
        graphPadding: 100
    }
});

The graph layout algorithm can also be used in the Diagram Editor. Its settings can be specified via the autoplacement config. This advanced feature helps end-users to build elaborate and neat-looking diagrams right from the UI much faster. Users just need to drag all required shapes from the left panel, link them with each other via connectors, and click on the “Auto Layout” button. The connected shapes will be instantly assembled into a well-organized diagram.

Diagram Editor with Auto Layout

Auto layout function in DHTMLX Diagram editor

If you need a feature-packed diagramming component with the auto layout functionality for your project and still haven’t tried DHTMLX Diagram, we encourage you to download a free 30-day trial version and estimate its capabilities in a real-case scenario.

Related Materials:

The post Using Layout Algorithms to Arrange Diagram Shapes Automatically appeared first on DHTMLX Blog.


How to Create a JavaScript Tree Diagram with DHTMLX

$
0
0

It is high time to expand your arsenal of data visualization tools with one more diagram type that can be implemented with the DHTMLX Diagram library. We are willing to share with you a comprehensive guide on how to produce JavaScript tree diagrams. All you have to do is to download a trial version of our diagram library and adhere to detailed instructions that are provided in this post.

What is a Tree Diagram

A tree diagram is a widely used tool that allows graphically presenting various kinds of data in the hierarchical or tree-like structure. It commonly consists of tree elements (nodes) that are joined together with connection lines (branches), vividly illustrating parent-child relations between nodes. Using this type of diagram, you can enjoy a simple data representation concept, the possibility to easily trace dependencies between diagram elements, and clarity of the provided info.

Thanks to the combination of simplicity and high adaptability, JavaScript tree diagrams (also named as tree graphs) have gained popularity in various fields of application such as:

  • Different areas of business management like staff management (org charts) or task management (WBS diagram)
  • Computer science (tree data structure, decision tree)
  • Mathematics (probability theory)
  • Biology (evolutionary tree)
  • Genealogy (family tree), and other traditional branches of knowledge.
JavaScript Family Tree

JavaScript Family Tree by DHTMLX

Apart from the widespread use in organizational hierarchies, tree diagrams are popular in genealogy for family tree visualization. A JavaScript family tree is a type of diagram intended for visually presenting kin relationships and generational bonds within a family. These diagrams can be utilized not only in academic disciplines like history or genealogy but also by ordinary people interested in their ancestry.

The example above depicts a part of the British royal family tree with the line of succession highlighted in red.

Example of a JavaScript Tree Diagram by DHTMLX

JavaScript Tree Diagram by DHTMLX

Let us have a closer look at the instance of a JavaScript tree diagram generated by the DHTMLX Diagram library.

The diagram above is an org chart, which showcases the hierarchical organizational structure of a medical institution. It comes with custom shapes that include visual and textual info about medical workers: a doctor’s photo, name, position, fields for contact information (phone number and email) as well as icons and labels.

Custom shapes of JS tree diagram

Straight and orthogonal connectors (branches) demonstrate the staff reporting structure.

How to Create a JavaScript Tree Diagram with DHTMLX

Now we are going to gain insight into the sequence of actions performed with our JavaScript library for drawing tree diagrams like in the example above.

1. Initialize the JavaScript tree diagram:

<!DOCTYPE html>
<html>
<head>
  <script type="text/javascript" src="codebase/diagram.js"></script>    
  <link rel="stylesheet" href="codebase/diagram.css">
  <link href="https://cdn.materialdesignicons.com/4.5.95/css/materialdesignicons.min.css?v=3.0.2" media="all" rel="stylesheet" type="text/css">
</head>
<body>
  <div id="diagram"></div>
  <script>
    const diagram = new dhx.Diagram("diagram", {
      type: "org",
      defaultShapeType: "template"
    });
 </script>
</body>
</html>

The first steps that must be taken before the initialization are the following:

  • add DHTMLX Diagram JS and CSS source files
  • create a container to embed your tree diagram into it
  • add a CDN file with Material Design icons to be used in personal cards of medical workers

Then call the dhx.Diagram constructor to carry out the initialization of your tree diagram. The constructor function comes with two parameters: an already created container and an object with configuration properties. In the configuration object, you have to define the type:”org” property to create an org chart, which is a kind of a tree diagram for showing the organization hierarchy. Besides, you need to specify the type of diagram shapes via the defaultShapeType property.

2. Set the default configuration for diagram shapes:

const defaults = {
      height: 115,
      width: 330
 };

You can speed up the process of creating your JavaScript tree diagram from scratch by applying the defaults config. It enables you to set common characteristics of specific elements for all shapes at once. Our example of the tree diagram consists of 12 nodes with the same dimensions (115 x 330). So, we can specify the default height and width for them.

3. Create a template for custom shapes:

  const template = ({ photo, name, post, phone, mail }) => (`
    <div class="dhx-diagram-demo_personal-card">
      <div class="dhx-diagram-demo_personal-card__container dhx-diagram-demo_personal-card__img-container">
             <img src="${photo}" alt="${name}-${post}"></img>
      </div>
      <div class="dhx-diagram-demo_personal-card__container">
            <h3>${name}</h3>
            <p>${post}</p>
            <span class="dhx-diagram-demo_personal-card__info">
                <i class="mdi mdi-cellphone-android"></i>
                <p>${phone}</p>
            </span>
            <span class="dhx-diagram-demo_personal-card__info">
                <i class="mdi mdi-email-outline"></i>
                <a href="mailto:${mail}" target="_blank">${mail}</a>
            </span>
      </div>
    </div>
  );

When it comes to the creation of a custom shape for your tree diagram, the first thing you should do is set up an HTML template for shapes. We apply the ES6+ standard for this purpose.You can define all required attributes of custom shapes via this template:

  • photo of a medical worker
  • doctor’s name and position
  • phone icon from the package of Material design icons and phone number
  • email icon and email address link

4. Add shapes to the tree diagram:

diagram.addShape("template", {
    template,
    defaults
});

The following step will be the addition of custom shapes to your JavaScript tree graph. It can be done with the addShape method. This simple method enables you to swiftly add various shapes utilizing templates and the default configuration of shapes.

5. Prepare and parse data into the diagram:

diagram.data.parse(data);

const data = [
    {
        id: "main",
        name: "Kristin Mccoy",
        post: "Medical director",
        phone: "(405) 555-0128",
        mail: "kmccoy@gmail.com",
        photo: "https://docs.dhtmlx.com/diagram/samples/common/big_img/big-avatar-1.jpg",
    },
    {
        id: "1",
        name: "Theo Fisher",
        post: "Head of department",
        phone: "(405) 632-1372",
        mail: "tfisher@gmail.com",
        photo: "https://docs.dhtmlx.com/diagram/samples/common/big_img/big-avatar-2.jpg",
        parent: "main"
    },
    {
        id: "1.1",
        name: "Francesca Saunders",
        post: "Attending physician",
        phone: "(402) 371-6736",
        mail: "fsaunders@gmail.com",
        photo: "https://docs.dhtmlx.com/diagram/samples/common/big_img/big-avatar-3.jpg",
        parent: "1",
        open: false
    },
    {
        id: "2",
        name: "Alisha Hall",
        post: "Head of department",
        phone: "(405) 372-9756",
        mail: "ahall@gmail.com",
        photo: "https://docs.dhtmlx.com/diagram/samples/common/big_img/big-avatar-4.jpg",
        parent: "main",
        open: false
    },
    {
        id: "2.1",
        name: "Milena Hunter",
        post: "Attending physician",
        phone: "(124) 622-1256",
        mail: "mhunter@gmail.com",
        photo: "https://docs.dhtmlx.com/diagram/samples/common/big_img/big-avatar-25.jpg",
        parent: "2",
        dir: "vertical",
    },
    {
        id: "2.2",
        name: "Maximus Dixon",
        post: "Medical director",
        phone: "(264) 684-4373",
        mail: "mdixon@gmail.com",
        photo: "https://docs.dhtmlx.com/diagram/samples/common/big_img/big-avatar-29.jpg",
        parent: "2",
        dir: "vertical",
    },
    {
        id: "3",
        name: "Edward Sharp",
        post: "Head of department",
        phone: "(451) 251-2578",
        mail: "esharp@gmail.com",
        photo: "https://docs.dhtmlx.com/diagram/samples/common/big_img/big-avatar-6.jpg",
        parent: "main",
        dir: "vertical",
    },
    {
        id: "3.1",
        name: "Cruz Burke",
        post: "Attending physician",
        phone: "(587) 234-8975",
        mail: "cburke@gmail.com",
        photo: "https://docs.dhtmlx.com/diagram/samples/common/big_img/big-avatar-7.jpg",
        parent: "3",
    },
    {
        id: "3.2",
        name: "Eloise Saunders",
        post: "Attending physician",
        phone: "(875) 231-5332",
        mail: "esaunders@gmail.com",
        photo: "https://docs.dhtmlx.com/diagram/samples/common/big_img/big-avatar-8.jpg",
        parent: "3",
    },
    {
        id: "3.3",
        name: "Sophia Matthews",
        post: "Attending physician",
        phone: "(361) 423-7234",
        mail: "smatthews@gmail.com",
        photo: "https://docs.dhtmlx.com/diagram/samples/common/big_img/big-avatar-9.jpg",
        parent: "3",
    },
    {
        id: "3.4",
        name: "Kara Foster",
        post: "Attending physician",
        phone: "(565) 525-0672",
        mail: "kfoster@gmail.com",
        photo: "https://docs.dhtmlx.com/diagram/samples/common/big_img/big-avatar-10.jpg",
        parent: "3",
    },
];

In order to fill your tree diagram with content, you have to apply the parse method.

6. Modify the appearance of specific elements in your JavaScript tree graph:

<style>
  .dhx-diagram-demo_personal-card {
    height: 100%;
    display: flex;
    align-items: center;
    justify-content: center;
    background: white;
    color: rgba(0, 0, 0, 0.7);
    border: 1px solid #DFDFDF;
    padding: 10px 12px;
  }
  .dhx-diagram-demo_personal-card i {
    color: rgba(0, 0, 0, 0.7);
      height: 20px;
      width: 20px;
      font-size: 18px;
  }
  .dhx-diagram-demo_personal-card__info {
    display: flex;
  }
  .dhx-diagram-demo_personal-card__info a {
    color:#0288D1
  }
  .dhx-diagram-demo_personal-card__container {
    height: 100%;
      width: 100%;
      overflow: hidden;
      position: relative;
  }
  .dhx-diagram-demo_personal-card__container h3, .dhx-diagram-demo_personal-card__container p {
    text-align: left;
    font-size: 14px;
    line-height: 20px;
    height: 20px;
    margin: 0 0 4px 0;
    overflow: hidden;
    text-overflow: ellipsis;
    white-space: nowrap;
  }
  .dhx-diagram-demo_personal-card__container i {
    margin-right: 4px;
  }
  .dhx-diagram-demo_personal-card__img-container {
    min-width: 93px;
      width: 93px;
      margin-right: 12px;
  }
  .dhx-diagram-demo_personal-card__img-container img {
    width: inherit;
    height: auto;
  }
</style>

And last of all, you can manipulate the look and feel of your HTML5 tree diagram by defining styles for personal card elements via CSS. You can apply a range of CSS properties to the elements of your choice and specify their dimensions, alignment, spacing, color, and any other settings.

Upon the completion of this final step, you can start using this tree diagram to outline the internal structure of a company.

Final Thoughts

This easy-to-follow guide shows how our JavaScript Diagram library can be used for building tree diagrams. Apart from this diagram type, you can build any other diagrams using simple HTML templates like network diagrams or UML class diagrams.

Take advantage of a 30-day free trial version and start diagramming right now.

Related Materials:

The post How to Create a JavaScript Tree Diagram with DHTMLX appeared first on DHTMLX Blog.

DHTMLX Pivot 1.5 for Angular, React, and Vue.js with TypeScript Support

$
0
0

The new release of DHTMLX Pivot 1.5 brings out integration examples for Angular, React, and Vue.js as well as built-in TypeScript definitions.

Now you can easily integrate the Pivot table into web applications based on the most popular frameworks and customize it according to your requirements. TypeScript support will help you write clean and stable code and achieve the desired results faster.

Download a free 30-day trial version of DHTMLX Pivot and start coding >

Integration Guides and Examples

We have prepared three step-by-step guides on how to work with DHTMLX Pivot in web applications based on Angular, React, and Vue.js. These guides cover three common aspects:

  1. How to initialize the project
  2. How to add Pivot to the page
  3. How to customize Pivot

Apart from guides in the documentation, there are live integration examples together with source code on our GitHub pages. Live examples demonstrate how to implement:

  • Initialization
  • Data loading
  • Data export
  • Loading inline data
  • Reloading Pivot structure
  • Custom marks
  • Custom formatting
  • Footer
  • Pivot events
  • Grid events

DHTMLX Pivot with footer

DHTMLX Pivot with totals in footer row

Guides and live examples enable you to create a Pivot table in your web application and extend it with the necessary features like applying conditional formatting to Pivot cells or adding the footer row for displaying totals.

DHTMLX Pivot conditional formatting

Conditional formatting of cells in DHTMLX Pivot (custom marks)

We invite you to check the examples of DHTMLX Pivot on GitHub:

Built-in TypeScript Definitions

Starting from v1.5, DHTMLX Pivot comes with embedded TypeScript type definitions. They allow developers to check types and use autocompletion, thus, greatly speeding up the development and reducing the number of code errors.
DHTMLX Pivot with type definitions

DHTMLX Pivot with TypeScript type definitions.

Other Improvements

Apart from new integrations and TypeScript support, our development team improved the work of the Excel export service, the algorithm for parsing data in the CSV format, and the alignment of columns with empty values.

We hope that from now on using DHTMLX Pivot in your projects will become much easier. You can grab the newly released evaluation version 1.5 and start your coding project right now!

As always, we invite our current clients to download the latest version of DHTMLX Pivot in their Client’s Area.

Our technical support team is ready and willing to help solve all your issues. Don’t hesitate to contact us if you have any questions.

DHTMLX JS Pivot Grid

Related Materials:

The post DHTMLX Pivot 1.5 for Angular, React, and Vue.js with TypeScript Support appeared first on DHTMLX Blog.

DHTMLX Vault 4.0: Enhanced Work on Touch Screens, Fast Switching Between Display Modes, and TypeScript Support

$
0
0

The new major release 4.0 of DHTMLX Vault delivers TypeScript support and enhanced work on touch screens. From now on, the DHTMLX file upload component provides file drag-n-drop, ability to select and remove several files at a time, toggle between the Grid and List modes, and pass custom parameters in the request header. Besides, there appear new events for listening to various user actions.

Download DHTMLX Vault 4.0 30-day free trial version >

TypeScript Support

First and foremost, the DHTMLX file upload component receives support for TypeScript. From now on, coding will become faster and easier due to embedded type definitions, autocompletion, and type checking. Check the sample >

Manipulating Multiple Files

Starting with v4.0, end-users can manipulate multiple files in the queue of our file uploader at the same time.
DHTMLX Vault allows selecting several files and deleting them just in one click.
JS File Upload Delete FIles

Check the sample >

File Drag-n-Drop

DHTMLX Vault makes it possible to reorder files in the queue using drag-n-drop. This feature is available by default in both Grid and List modes. Thus, you can select one or multiple files and move them all together.

JS File Drag-n-Drop

Check the sample >

Switching Between Grid and List Modes

Another novelty is the ability to toggle between the Grid and List modes while manipulating files. Both Grid and List controls are available in the toolbar by default now.

JS file uploader file preview

Check the sample >

You can still hide the mode controls via the modeControls config. If this config is set to false, the controls won’t be displayed and files will be arranged in a list.

var vault = new dhx.Vault("vault_container", {
    uploader: {
        // obligatory, the path for upload
        target:"/upload"
    },
    modeControls: false
});

The interface of DHTMLX Vault with these controls hidden looks like that:
Hidden file upload controls

The List mode with hidden mode controls. Check the sample >

Parameters of Request Headers

The release brings out the ability to include any custom parameters into the request header via the headerParams property of the Uploader configuration object. Thanks to that, developers can pass authentication tokens and any other parameters required.

var vault = new dhx.Vault(“vault”, {
uploader: {
    // obligatory, the path for upload
    target: "/upload",
    headerParams: {
        "firstCustomParam": "customValue",
        "secondCustomParam": "customValue",
        "thirdCustomParam": "customValue"
    }
 }
});
New Events

V4.0 enriched the API of DHTMLX Vault with a wide range of new events to make your app more interactive. Now our file uploader can listen to such user actions as dragging and dropping files, clicking and mouse hovering, and much more. Learn more >

Here is a free 30-day evaluation version of DHTMLX Vault. Download it and test the DHTMLX file uploader in your projects. We are looking forward to your feedback!

We invite our current clients to get the latest major version in their Client’s Area.

Our technical support team is always there to help if you face any difficulties in your work with DHTMLX components. We answer all your tickets on business days within 24 to 72 hours.

Related Materials:

Maintenance release: DHTMLX Gantt 7.0.10, Suite 6.5.6

$
0
0

Our development team has recently rolled out new releases for two DHTMLX products, namely Vault 4.0 and Pivot 1.5. Apart from these updates containing a number of new functionalities and fixes, we are eager to share with you some improvements implemented in Gantt and Suite libraries.

Check out the full list of enhancements for our main products below.

DHTMLX Gantt 7.0.10

7.0.10 (September 22, 2020)

  • (Fixed) the incorrect work of vertical resizers (the regression appeared in v7.0.9)
  • (Updated) Prevent unexpected page refresh which happened during vertical reordering of tasks on Android Chrome (pull-to-refresh)
  • (Fixed) the script error which fired during creating a link on mobile Firefox
  • (Fixed) the incorrect work of task selection when the multiselect config is enabled but the multiselect plugin is not activated
  • (Improved) the work of HTML select controls inside Inline Editors
  • (Fixed) the incorrect work of Auto Scheduling when linked tasks use different work calendars
  • (Updated) the gantt.plugins method will not activate plugins which are specified with false value
  • (Fixed) the conflict between Inline Editors and Keyboard Navigation
  • (Fixed) the issue that caused Inline Editors to close on double click

Learn more in the documentation >

Suite 6.5.4 – 6.5.6

6.5.4 (September 15, 2020)

  • (Fixed) the issue with the value of a cell when calling the afterEditEnd event of Grid
  • (Fixed) the issue with positioning of selection over frozen columns in Grid and TreeGrid
  • (Fixed) the incorrect work of the input filter of a Grid column when placing a grid into a shadowDOM
  • (Fixed) the incorrect work of the select filter of a Grid column after resizing of the column
  • (Fixed) the issue which caused hidden columns of Grid to be displayed in the exported Excel file
  • (Fixed) the incorrect behavior of scrolling Grid container when using keyboard navigation in a grid with frozen columns
  • (Fixed) the incorrect rendering of a Spline chart when a data set contains less than 3 records
  • (Fixed) the issue with visualization of the mark property of a Grid column after data reloading
  • (Fixed) the issue which caused a footer of a grid not to be included to the exported file

6.5.5 (September 17, 2020)

  • (Fixed) the behavior of the align property of a Grid column when the spans configuration option is used
  • (Fixed) the issue with rendering of Grid/TreeGrid

6.5.6 (October 5, 2020)

  • (Fixed) the incorrect work of the input filter of a Grid column when placing a grid into a shadowDOM while working in Firefox
  • (Fixed) the issue with key navigation in a grid placed to a layout cell, which caused key navigation to stop working after collapsing/expanding the layout cell
  • (Fixed) the incorrect work of the select filter of a Grid column after resizing the column
  • (Fixed) the issue with ignoring alignment of data in the column’s header while using spans in Grid
  • (Fixed) the incorrect behavior of editors when working with several grids on one page
  • (Fixed) the issue with the width of expanded items in Tree
  • (Fixed) the incorrect work of selection in Grid cells when using key navigation on a page with several grids

Learn more in the documentation >

Download the latest versions of our libraries and test them free of charge for 30 days:

Current clients may find the updated packages in their Client’s Area.
Feel free to leave your comments on this maintenance release and stay tuned for future updates!

The post Maintenance release: DHTMLX Gantt 7.0.10, Suite 6.5.6 appeared first on DHTMLX Blog.

Customer Spotlight: DHTMLX Gantt in Lean IT

$
0
0

Today we are talking to Raffaele Marranzini, the CEO of Lean IT, the Swiss software company specializing in product lifecycle management (PLM) solutions. We are proud that Lean IT has relied on our Gantt chart to embed it in their cloud-based application for product and project management. Raffaele shares their company’s story and experience with DHTMLX Gantt in a 30-minute interview.

Raffaele, thank you for being our guest in the interview today. Please tell us about yourself and your role in Lean IT.

My name is Raffaele Marranzini. And it’s nice talking to you. I’m the CEO at Lean IT Consulting. My role is being the CEO around marketing, sales, defining strategies, defining the vision.

Lean IT Consulting was born as an IT consulting company, as the name suggests. Over time we specialized in PLM – product lifecycle management. So we provide IT services for large companies requiring a product lifecycle management system.

PLM is basically a group of processes that help companies manage their product data from the ideation phase until the withdrawal from the market of their product.

We also deal with life science companies, even though we are not limited to that. And that’s in a nutshell how we were born.
Lean IT

Source: Lean IT

The core of our skill is around software development, software analysis, implementation, and testing. A couple of years ago, we decided to differentiate our offering with not only services but also products. We leveraged the experience we made during the years on PLM to implement a few products that would help large companies to deal with the initial stages of the life cycle of the product, which is basically the innovation management piece.

By innovation management, we mean the very early stage when you do not have a product, you just have an idea. You formalize this idea into an idea management system. Once your idea is mature enough, it gets transformed into eventually something real – the development of a new product.

This is where the second chapter of innovation management comes into play, which is the new product development project.

It is a project with a number of tasks where you assign resources, which could be a person or a team or whatever. This project has to go through a number of milestones or stages or gates. This is very common in the entire project and program management area.

This is where the third part of our software comes into help – launch management. By launch management, we mean managing the business case for a particular launch. You make a forecast of how much sales you expect to have for that particular product. And maybe you also evaluate how much money you are expecting to spend in terms of advertising. Once your project is approved and rolling, you will organize to start production of your product, you decide where to produce it, and when it should be shipped to the stores. The objective there is to reach your customers on time.

One of the pain points we keep hearing from our clients is that their go-to-market time is too long. A good innovation management system like ours, hopefully, will help them reach the market more effectively and in time, meaning that they have realistic planning in terms of money and time. This is what our product does.

With the help of DHTMLX Gantt, our tools will help clients to decommission legacy and standalone tools that may not be suitable to scale up together with the business. We also have vast capabilities in terms of integrating with third-party systems that may already be in the client’s IT landscape. We believe that our tools will certainly help our clients to obtain relevant efficiency gains as a result of better information sharing and collaboration, optimal project scheduling, and extensive resource management.

So DHTMLX Gantt is part of your PLM software?

Where is DHTMLX into this picture? We purchased the Ultimate license for DHTMLX Gantt. We are embedding your product into our software. Especially for the parts where you will need the project schedule, the project Gantt, like for the NPD management. New product development management is a lot about project management and about program management.

We were initially planning to support only the management of the schedule in MS Project itself. Based on our understanding of the market, many clients liked to continue using MS Project in whatever form, on the desktop, on the web, or on the intranet, because it’s a market standard.

We said clients want to use MS Project, let them continue to use MS Project. So our application would interface with MS Project files or for the server – with their APIs to pull schedule data from wherever it is. If it’s in a file, our product would parse the file and figure what data exactly is in the file itself.

And this worked okay for larger clients. However, we realized that there is a fair number of clients that did not require all the complexity that is within MS Project because obviously, MS Project has 20+ more years of experience. It is a market standard, but it’s also offering a number of features that people do not use or do not need or do not even know about. And also there is a large number of smaller companies that didn’t want to make an investment to buy MS Project licenses for their project managers because it’s a relevant investment. So they were preferring to do fancy things like continue using Excel, which is probably the worst solution ever.

So we thought it would have been great if we could offer an alternative. And this is where your product comes into play. We said, okay, let us not only offer integration with MS Project in all its forms but let us also offer an embedded solution for project schedule management, for project Gantt management.

We are currently working on embedding your DHTMLX Gantt inside our application in order to allow the management of schedules directly embedded into our application. No more files, no more external systems to connect to. We just add your library, your Gantt to our application, which is, by the way, a web application. We embed your thing into our software so that it would store project data not on files but on a database, in our case, it’s a Mongo database, a NoSQL database. You can actually do the project management part directly within our tool without having to install or buy anything else. It’s a ready-made solution that you can just purchase eventually on the cloud and use it. That’s the idea behind the purchase of your license.

What we are doing right now is to develop the backend to your frontend in order to implement all the logic required to save in the NoSQL database, to do data analysis once the data is there and reporting. We are hoping to be ready with that somewhere in the next few months. And we are going to offer that mainly on the cloud. Our solution is a cloud-based solution.

If that is not the case, if that is not working for a particular client of relevant size, we can also evaluate the opportunity to install our software on-premise at the client-side so that they have all their data in their own data centers, not necessarily on the cloud. In the beginning, like a year ago, talking about cloud-based solutions for new product development projects was kind of scary to the clients, because obviously thinking that all your innovation pipeline is somewhere in the cloud sounds scary. Recently this has been less the case. In fact, our cloud-based solution is working okay.

How hard is it to implement DHTMLX Gantt in your application from the technical point of view? Is it hard to learn the API?

Understanding the basics of your API was okay. It did not take longer than it took for other APIs we had to learn.

The largest amount of time we have invested so far, however, was in trying to figure out what is the solution to performance issues we have found with your product. We realized that when a project extends for a very long amount of time like eighty years, which might be the case for a complex new product development project, the performance of your application, of the frontend of your application, becomes very slow. We had to fight our way around it in order to make it work.

There has also been quite some time invested from our side to learn how you implemented parts of the logic that you embedded within your tool. In Microsoft Project, you deal normally with schedule dates and actual dates. A schedule date is what you initially planned and an actual date is what actually happened, when a task actually started, when a task actually ended, how much time it took. Based on the feedback I received from our developers sometimes your tool applies some logic to make a distinction between the two or it doesn’t make a distinction between the two, which took us a while to figure first and to adapt.

Second, the most time-consuming part with your product was dealing with your support. We have the highest possible license, which means that you are supposed to answer within a very short time. We are fairly happy with your timing. But the part where we invested a relevant amount of time was explaining what the issue was to your support team and helping them to replicate the issue. They have a sandbox of some kind that we have to configure for them to actually see the issue happening. Our recommendation would be instead of us investing time to precisely replicate the issue for you, you invest that time. Hopefully in the end it would be less work on our side even though it takes a little longer for the issue to be resolved.

It’s precious to get such feedback. We will discuss it and find ways for improvement. I have just a couple of questions left. What other technologies do you use with DHTMLX Gantt?

We are working on Java mainly. The framework we are using in Java is Angular.

And why did you choose DHTMLX Gantt, all in all?

Because we have been doing a thorough software assessment of your product when compared to other products. And what convinced us was the amount of features that your product was offering and which is larger based on our understanding when compared to your competitors we found.

Could you name the most important features that influenced your decision to choose DHTMLX Gantt?

The first one that pops into my mind is the ability to export or import from MS Project and other formats like PNG, PDF, Excel.

Raffaele, thank you for spending your time with us and sharing your experience of working with DHTMLX Gantt! We appreciate your feedback and ideas and we’ll be looking forward to the launch of your project involving our Gantt chart.

Our readers can get acquainted with other DHTMLX clients’ stories on our blog. If you are new to DHTMLX, learn more about our HTML5 Gantt chart on our website.

The post Customer Spotlight: DHTMLX Gantt in Lean IT appeared first on DHTMLX Blog.

Viewing all 228 articles
Browse latest View live